

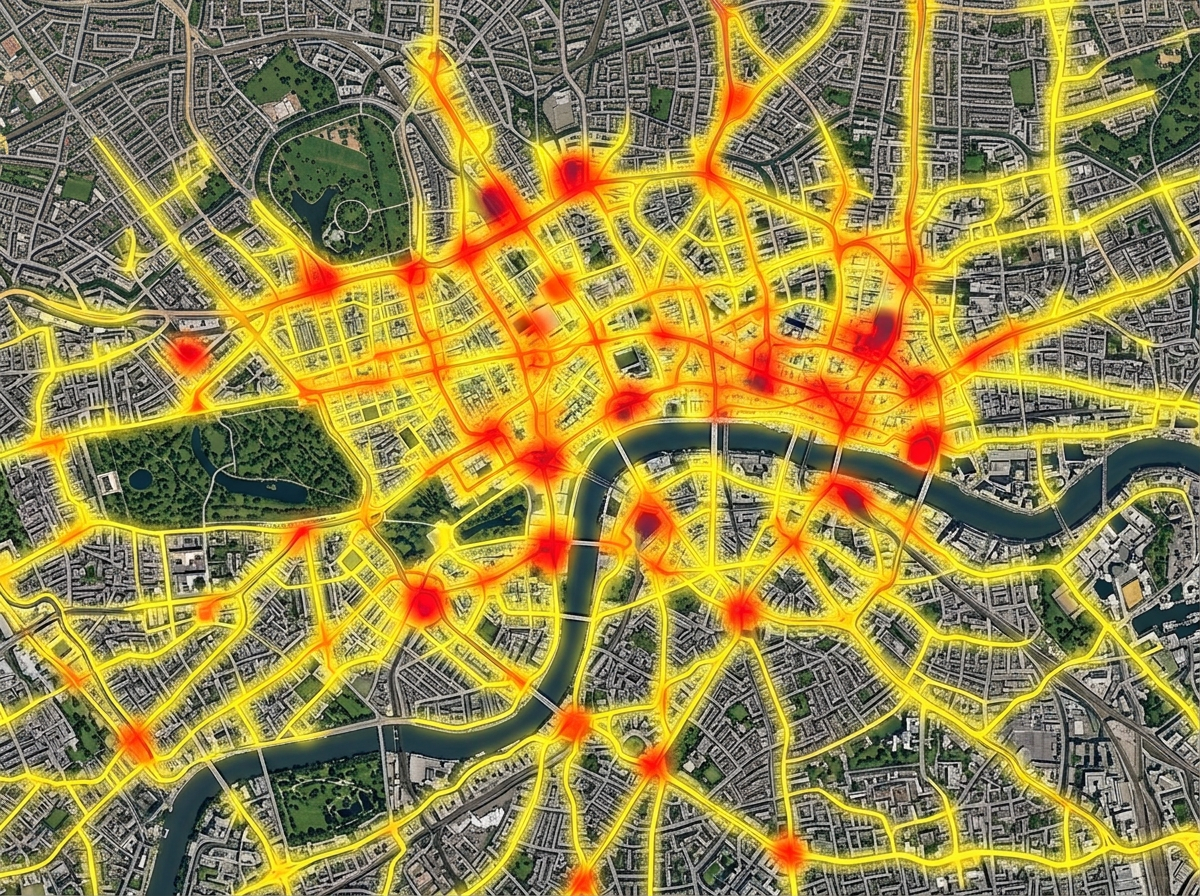
Heatmaps of activity
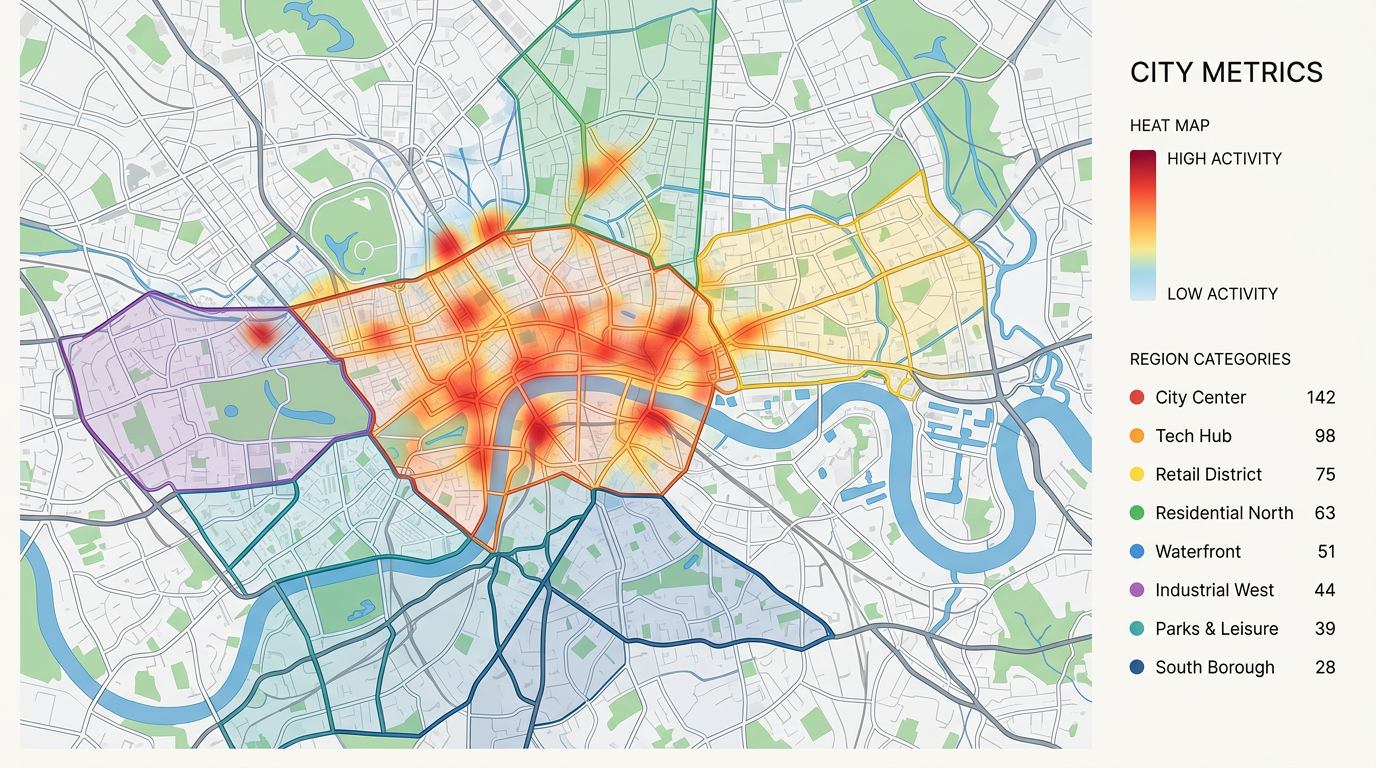
Turn thousands of pins into a single heat layer. See where your customers, calls, sales, or incidents cluster and where they fall off.

 English
 Español
 Français
 Deutsch
 Português
 日本語
 中文
 العربية
 한국어
 Italiano
 Русский
 Türkçe
 Nederlands
 Polski
 हिन्दी
 Dansk
 Čeština
 Română
 Ελληνικά
 Tiếng Việt
 Suomi
 Українська
 Indonesia
 Svenska
 Norsk bokmål
 Hrvatski
 Magyar
 Български
 中文(繁體)
 Slovenčina
 Srpski
 ไทย
 Eesti
 Català
 Lietuvių
 עברית
 Slovenščina
 فارسی
 Latviešu
 Azərbaycan
 Беларуская
 Melayu
 Bosanski
 ქართული
 Shqip
 Gaeilge
 Монгол
 ဗမာ
 O‘zbek
 اُردو
 Македонски
 ខ្មែរ
 Nynorsk
 বাংলা
 Galego
 Euskara
 Íslenska
 தமிழ்
 ລາວ
 ગુજરાતી
 Latina
 मराठी
 Қазақ тілі
 ਪੰਜਾਬੀ
 Afrikaans
 नेपाली
 አማርኛ
 తెలుగు
 ChiShona
 Cymraeg
 Føroyskt
 অসমীয়া
 Brezhoneg
 Esperanto
 Basa Jawa
 کٲشُر
 Ирон
 Sardu
Plot your data on a map and read it like a chart. Build heatmaps, color regions by value, size pins by amount, and cluster busy areas. Find hot spots, gaps, and trends in seconds.
★ ★ ★ ★ ★“Data import and output and management tools, including polygons, heatmaps, unit data, geolocation, screening, and data import, are all easily accessible.”
Heatmaps for density. Color by category. Size by value. Region fills for counts by zip or county. Switch between views without re-importing your data.
Import a CSV, Excel, or GeoJSON file. We read your columns and build the visual. No SQL, no chart library, and no developer needed.
Send a link, embed the map in a report, or export a PDF for a deck. Every viewer reads the same map and can pan, zoom, and click to dig in.
Turn thousands of pins into a single heat layer. See where your customers, calls, sales, or incidents cluster and where they fall off.

Fill zip codes or counties by sales, population, or any number from your file. Read the map like a chart and spot leaders and laggards in seconds.

When a map has too many pins, cluster them into counts. Zoom in to break clusters apart and zoom out to see the big picture.
Scribble AI
告訴Scribble AI您需要什麼。試試「在每個地點周圍繪製500m緩衝區」、「匯入此CSV並依狀態著色」或「測量從倉庫到每個停靠點的路線」。幾秒鐘就能完成。無需GIS訓練,您的團隊也能取得同一張可直接分享的地圖。
試用Scribble AI →Map data visualization means showing your data on a map so patterns become easy to read. You can use heatmaps, colored regions, sized pins, and more to find trends a spreadsheet would hide.
Any data with a location. That can be addresses, latitude and longitude, zip codes, counties, or shapes. Bring it in as CSV, Excel, KML, or GeoJSON.
Yes. Stack a heatmap, region fills, and pins on the same map. Viewers can toggle layers to focus on what matters to them.
Yes. Copy the embed snippet and paste it into a dashboard, report, or website. The map stays live, so updates show up the next time someone opens the page.