

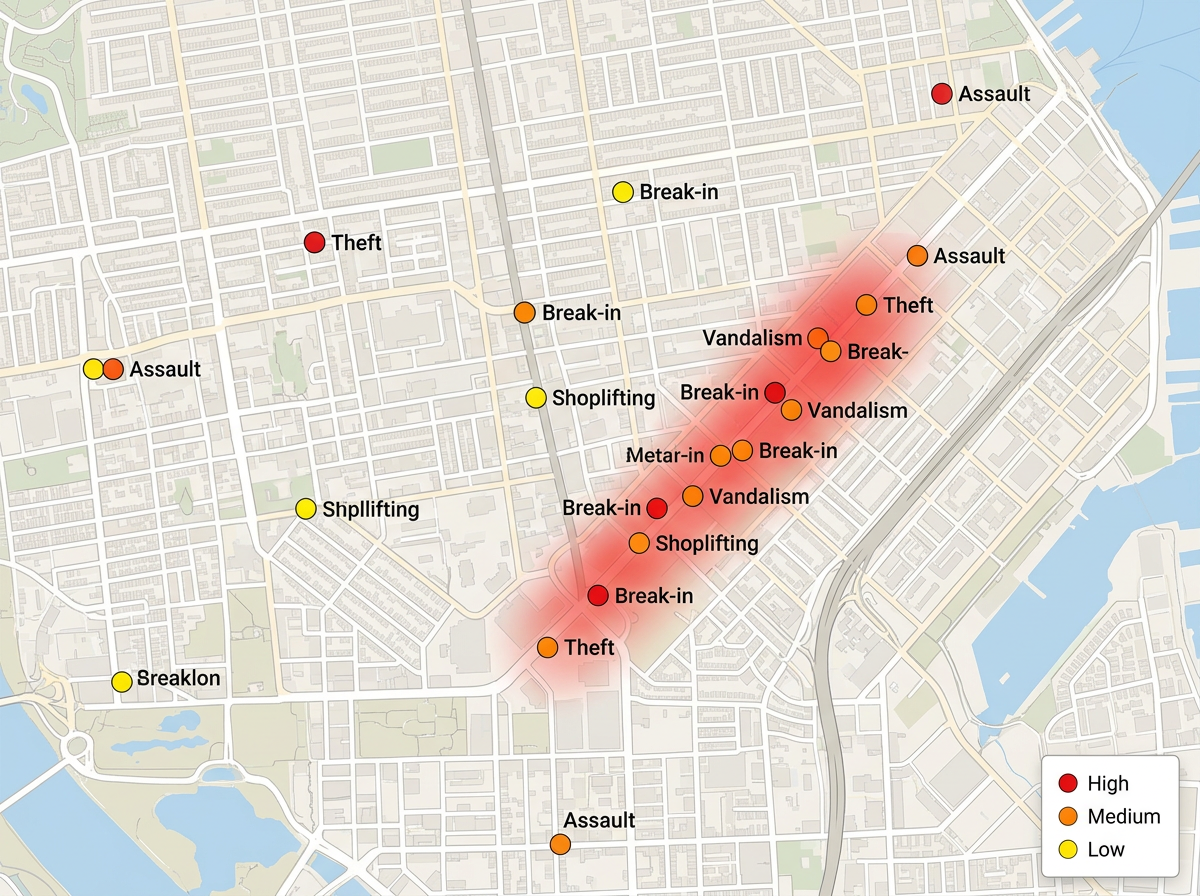
Plot incidents and threats
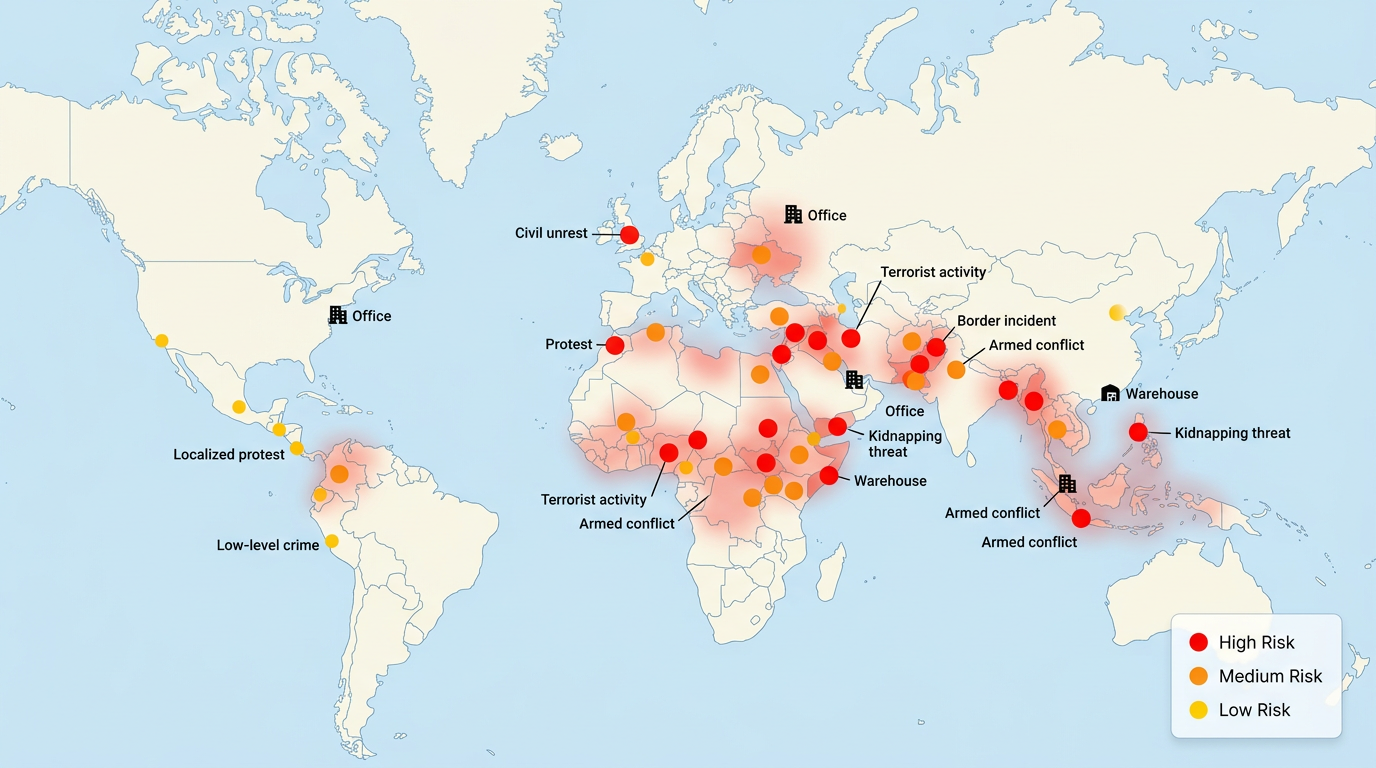
Map crime, security incidents, and threats by location. Color markers by severity and group them by type. Build a clear view of where risk is rising.

 English
 Español
 Français
 Deutsch
 Português
 日本語
 中文
 العربية
 한국어
 Italiano
 Русский
 Türkçe
 Nederlands
 Polski
 हिन्दी
 Dansk
 Čeština
 Română
 Ελληνικά
 Tiếng Việt
 Suomi
 Українська
 Indonesia
 Svenska
 Norsk bokmål
 Hrvatski
 Magyar
 Български
 中文(繁體)
 Slovenčina
 Srpski
 ไทย
 Eesti
 Català
 Lietuvių
 עברית
 Slovenščina
 فارسی
 Latviešu
 Azərbaycan
 Беларуская
 Melayu
 Bosanski
 ქართული
 Shqip
 Gaeilge
 Монгол
 ဗမာ
 O‘zbek
 اُردو
 Македонски
 ខ្មែរ
 Nynorsk
 বাংলা
 Galego
 Euskara
 Íslenska
 தமிழ்
 ລາວ
 ગુજરાતી
 Latina
 मराठी
 Қазақ тілі
 ਪੰਜਾਬੀ
 Afrikaans
 नेपाली
 አማርኛ
 తెలుగు
 ChiShona
 Cymraeg
 Føroyskt
 অসমীয়া
 Brezhoneg
 Esperanto
 Basa Jawa
 کٲشُر
 Ирон
 Sardu
Plot incidents, pull in live global event data, and turn it into a clear risk picture. Share the map by link or export it for the board. No GIS training required.
★ ★ ★ ★ ★“Scribble Maps is one of the only software available that lets you make a fully customizable map.”
Drop markers for incidents, threats, and assets. Color them by severity. Import a spreadsheet of events and they land on the map by address or coordinates.
Pull in GDELT global event data to see protests, unrest, and conflict as they are reported. Filter by region and event type so the map shows what matters.
Share the map by link or export to PDF and PNG. Leaders open it on any device and see the same risk picture. No account and no install needed.
Map crime, security incidents, and threats by location. Color markers by severity and group them by type. Build a clear view of where risk is rising.
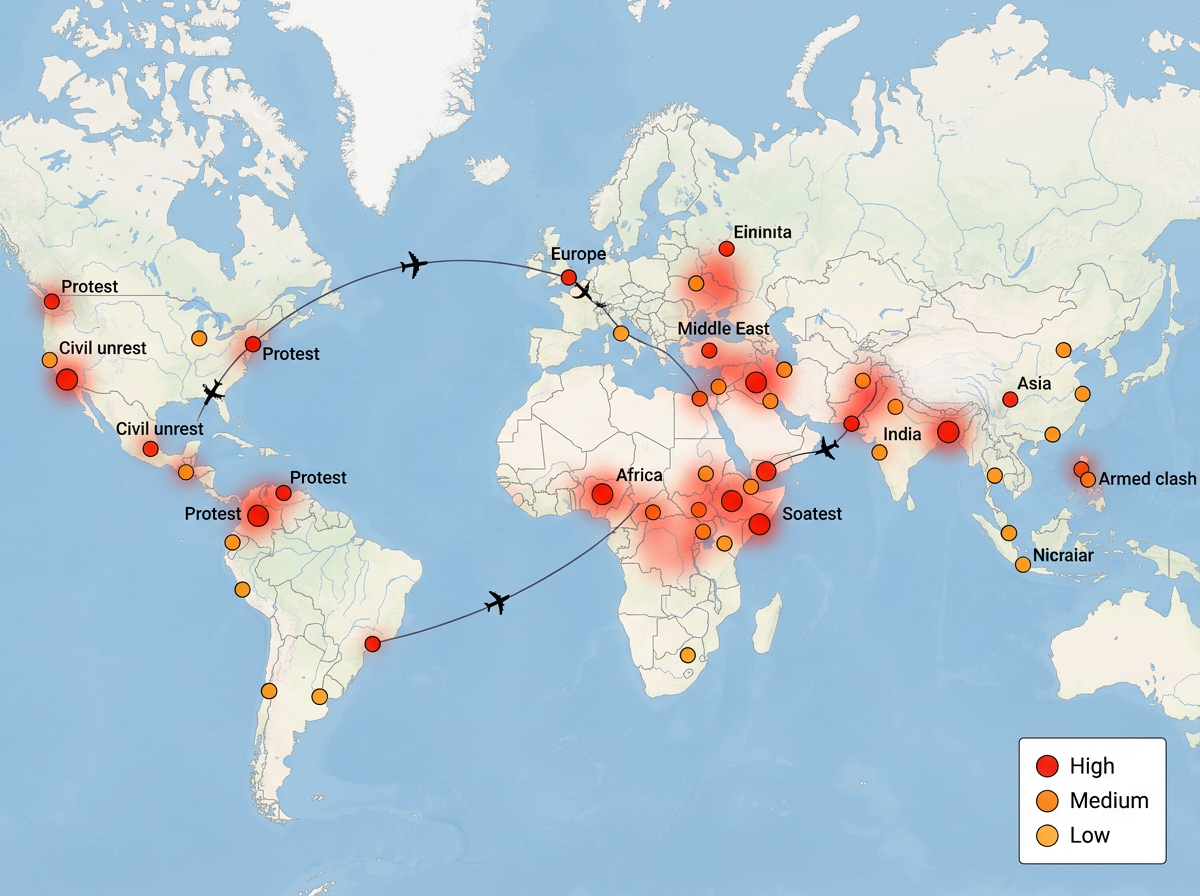
Watch protests, unrest, and conflict worldwide with live GDELT event data. See where staff travel meets rising risk and act early on duty of care.
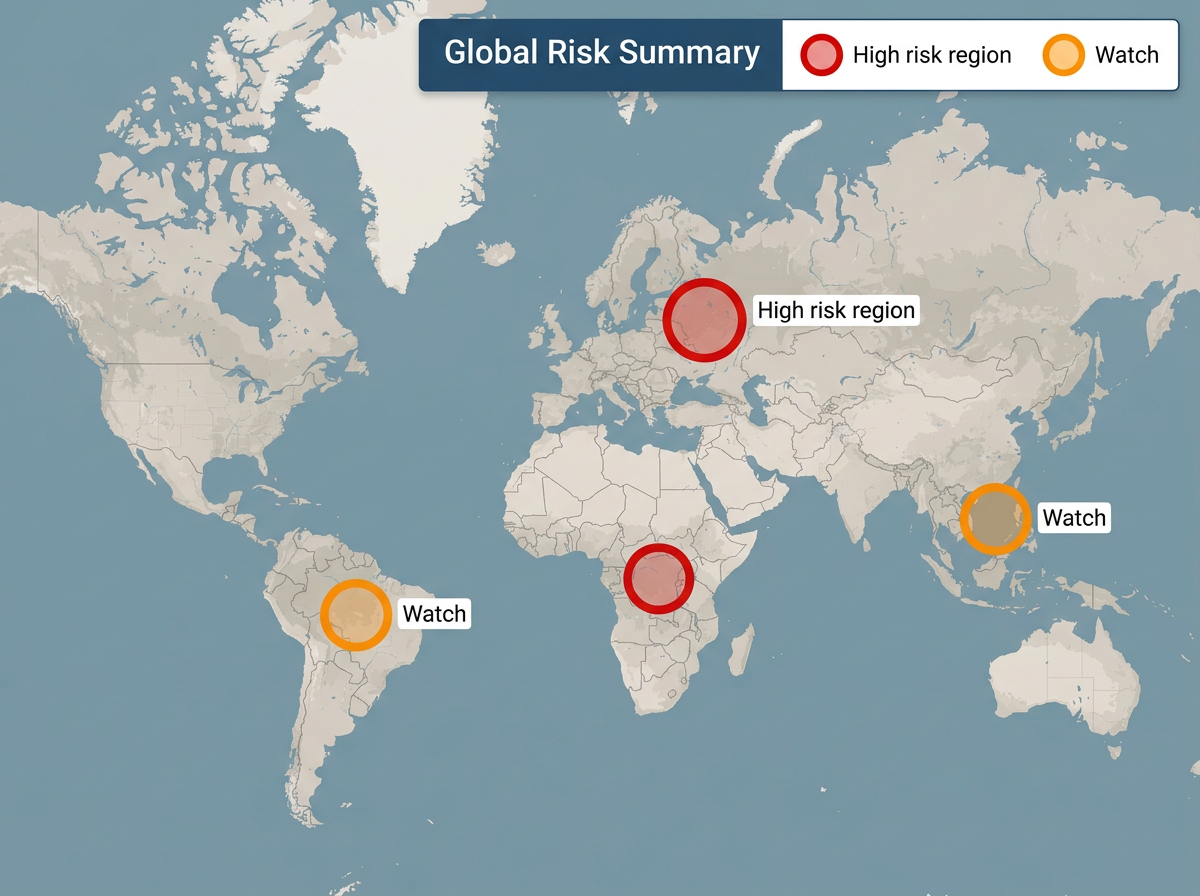
Turn raw events into a clean map leaders understand at a glance. Share by link for live updates or export a snapshot for the briefing deck.
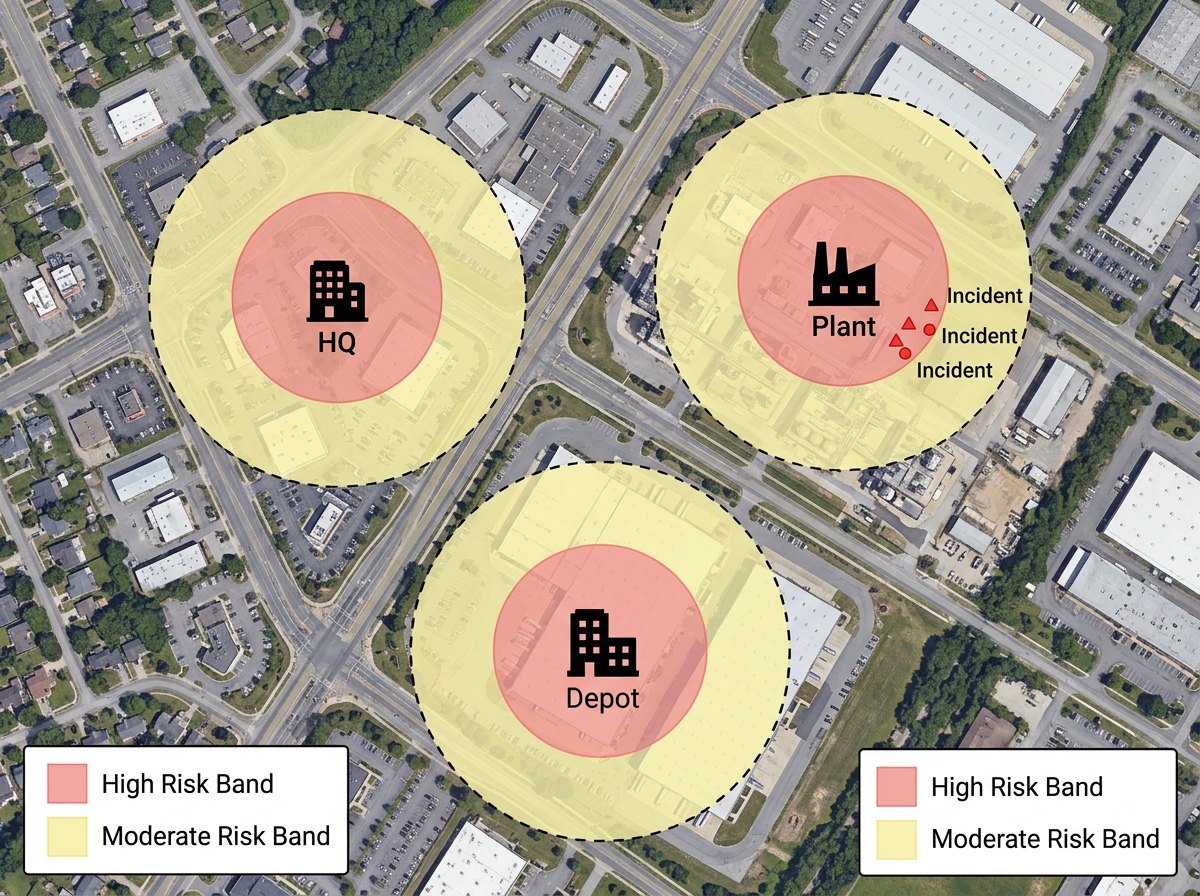
Place your offices, sites, and staff on the map. Overlay nearby risk events and hazard zones to see which assets are most exposed and plan a response.
Scribble AI
告訴Scribble AI您需要什麼。試試「在每個地點周圍繪製500m緩衝區」、「匯入此CSV並依狀態著色」或「測量從倉庫到每個停靠點的路線」。幾秒鐘就能完成。無需GIS訓練,您的團隊也能取得同一張可直接分享的地圖。
試用Scribble AI →Security risk mapping is plotting incidents, threats, and events on a map so you can see where risk is concentrated. Scribble Maps lets you build one from your own data and live event feeds, then share it with your team or leaders.
GDELT is the Global Database of Events, Language, and Tone. It tracks events like protests, unrest, and conflict from news worldwide and tags them with a location. Scribble Maps can plot these events so you see global risk as it is reported.
Yes. Import a spreadsheet, CSV, KML, GeoJSON, or Shapefile. Your incidents land on the map by address or coordinates and you can color them by severity.
Yes. Share a link and anyone can open the map in a browser. No account, no install, and no training needed. You can also export a snapshot for a slide deck.
Yes. Maps support AES-256 encryption and private sharing. Keep sensitive risk maps locked to your team and share a link only with the people who need it.
No. Pick a marker, set the location, and choose a color for severity. The map builds as you go, and the AI assistant can plot and style data for you on request.