

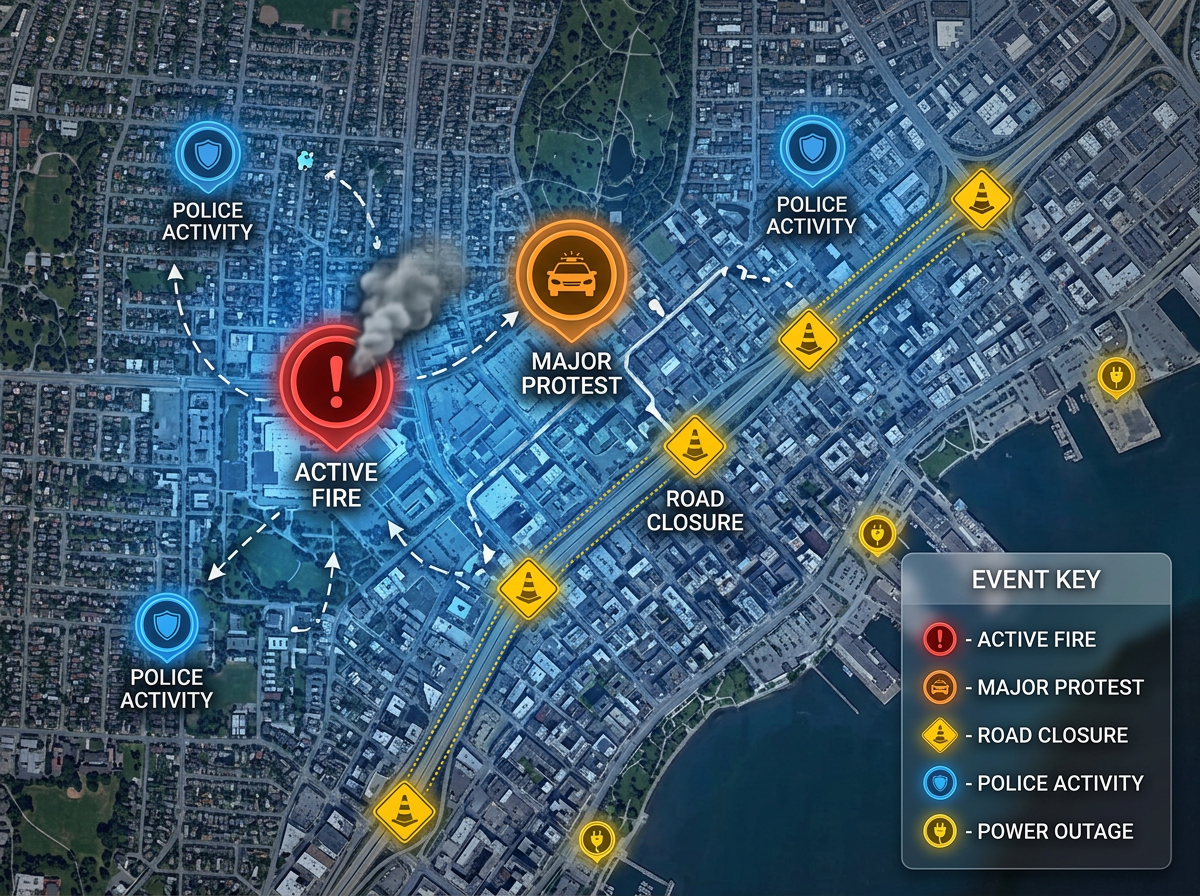
Breaking news location maps
Show readers where events are happening. Drop pins on key locations, label them clearly, and embed the map in your article within minutes.

 English
 Español
 Français
 Deutsch
 Português
 日本語
 中文
 العربية
 한국어
 Italiano
 Русский
 Türkçe
 Nederlands
 Polski
 हिन्दी
 Dansk
 Čeština
 Română
 Ελληνικά
 Tiếng Việt
 Suomi
 Українська
 Indonesia
 Svenska
 Norsk bokmål
 Hrvatski
 Magyar
 Български
 中文(繁體)
 Slovenčina
 Srpski
 ไทย
 Eesti
 Català
 Lietuvių
 עברית
 Slovenščina
 فارسی
 Latviešu
 Azərbaycan
 Беларуская
 Melayu
 Bosanski
 ქართული
 Shqip
 Gaeilge
 Монгол
 ဗမာ
 O‘zbek
 اُردو
 Македонски
 ខ្មែរ
 Nynorsk
 বাংলা
 Galego
 Euskara
 Íslenska
 தமிழ்
 ລາວ
 ગુજરાતી
 Latina
 मराठी
 Қазақ тілі
 ਪੰਜਾਬੀ
 Afrikaans
 नेपाली
 አማርኛ
 తెలుగు
 ChiShona
 Cymraeg
 Føroyskt
 অসমীয়া
 Brezhoneg
 Esperanto
 Basa Jawa
 کٲشُر
 Ирон
 Sardu
Build maps for breaking news, feature stories, and data journalism. Drop pins on events, draw boundaries, and embed interactive maps in your articles.
 4.7 / 5 · G2上有 200 則評論
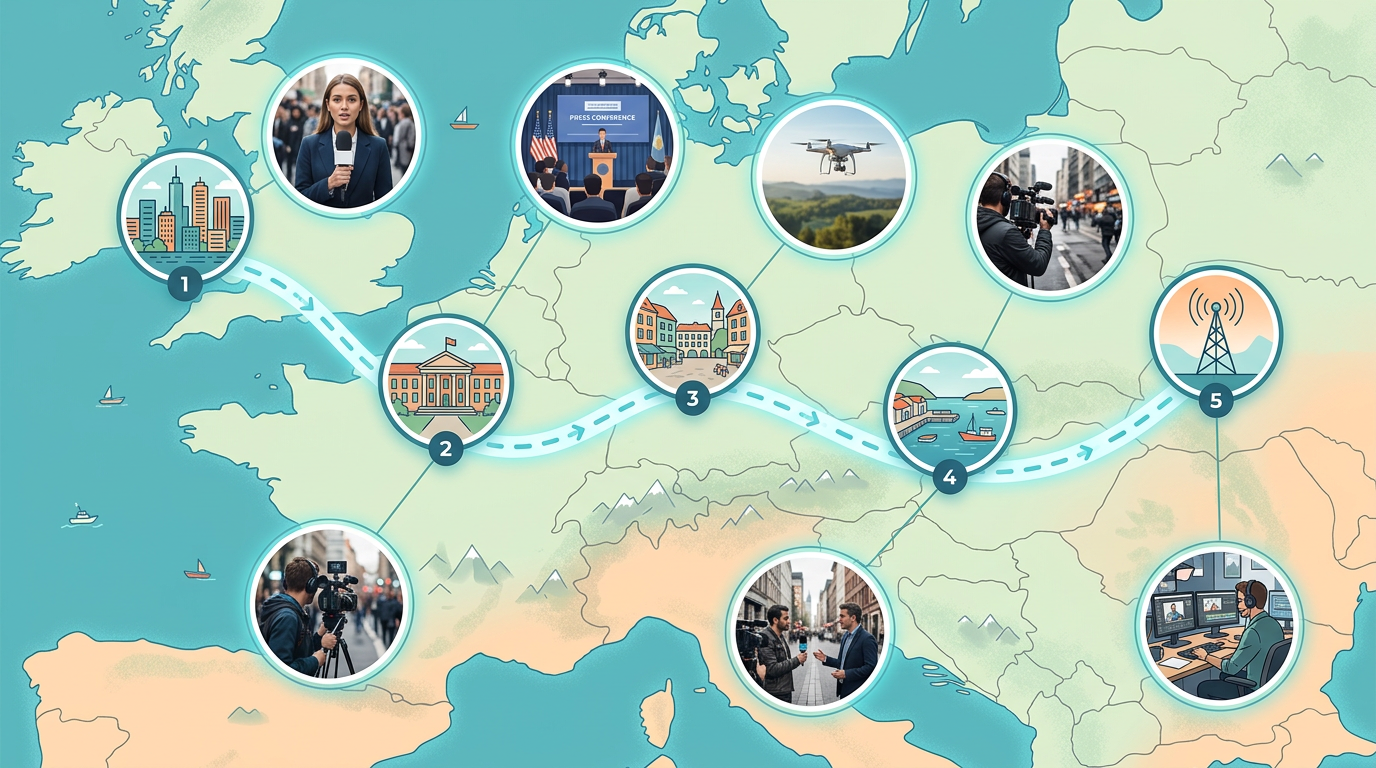
★ ★ ★ ★ ★“Scribble Maps lets our newsroom create professional maps in minutes. We used to wait days for graphics. Now reporters can build their own maps while writing the story.”
Pin locations, draw routes, and mark areas on satellite or street maps. Show readers exactly where events happened.
Copy the embed code and paste it into WordPress, Medium, or any CMS. The map loads fast and works on mobile.
Edit your map and readers see changes right away. Perfect for breaking news and developing stories.
Show readers where events are happening. Drop pins on key locations, label them clearly, and embed the map in your article within minutes.
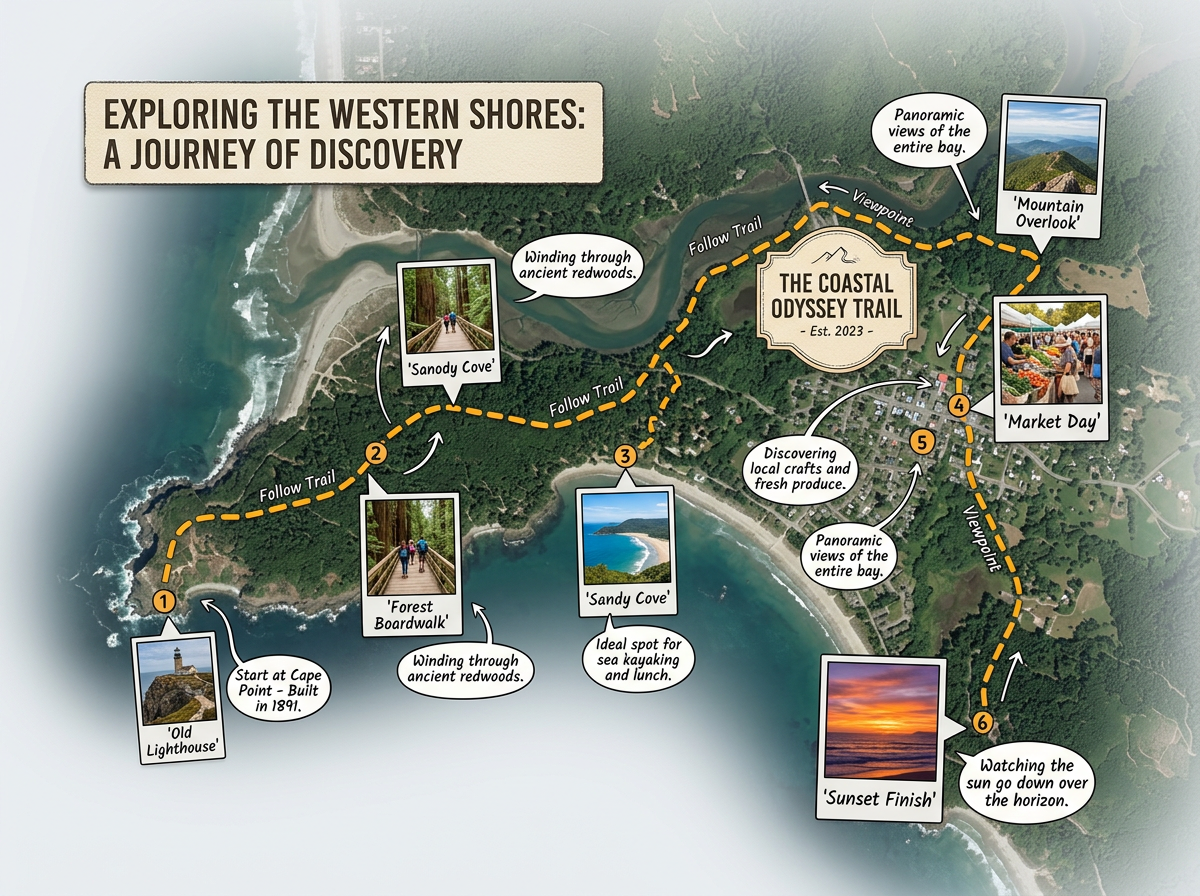
Build rich maps for long-form journalism. Add photos, draw routes, and layer data to help readers understand complex stories.
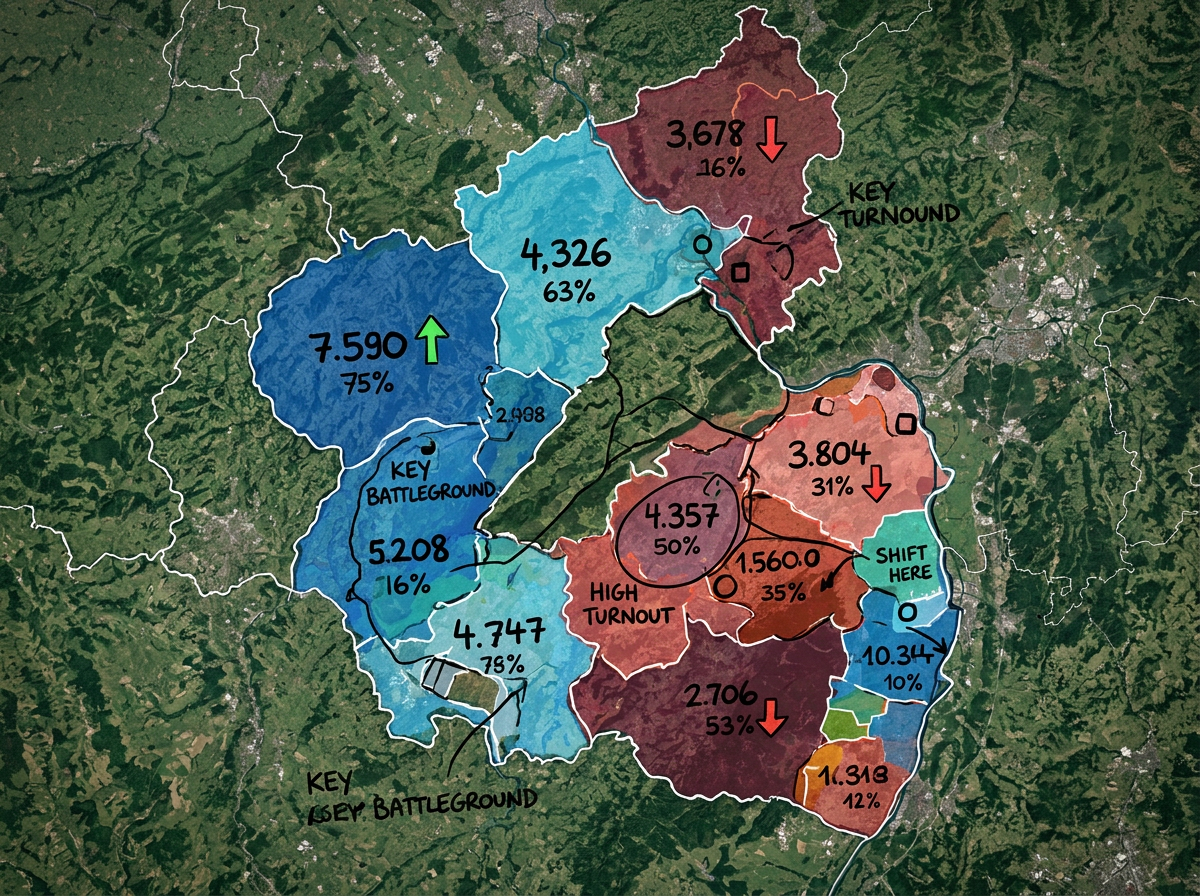
Color-code districts, show voting patterns, and map campaign events. Create clear graphics that explain election results.
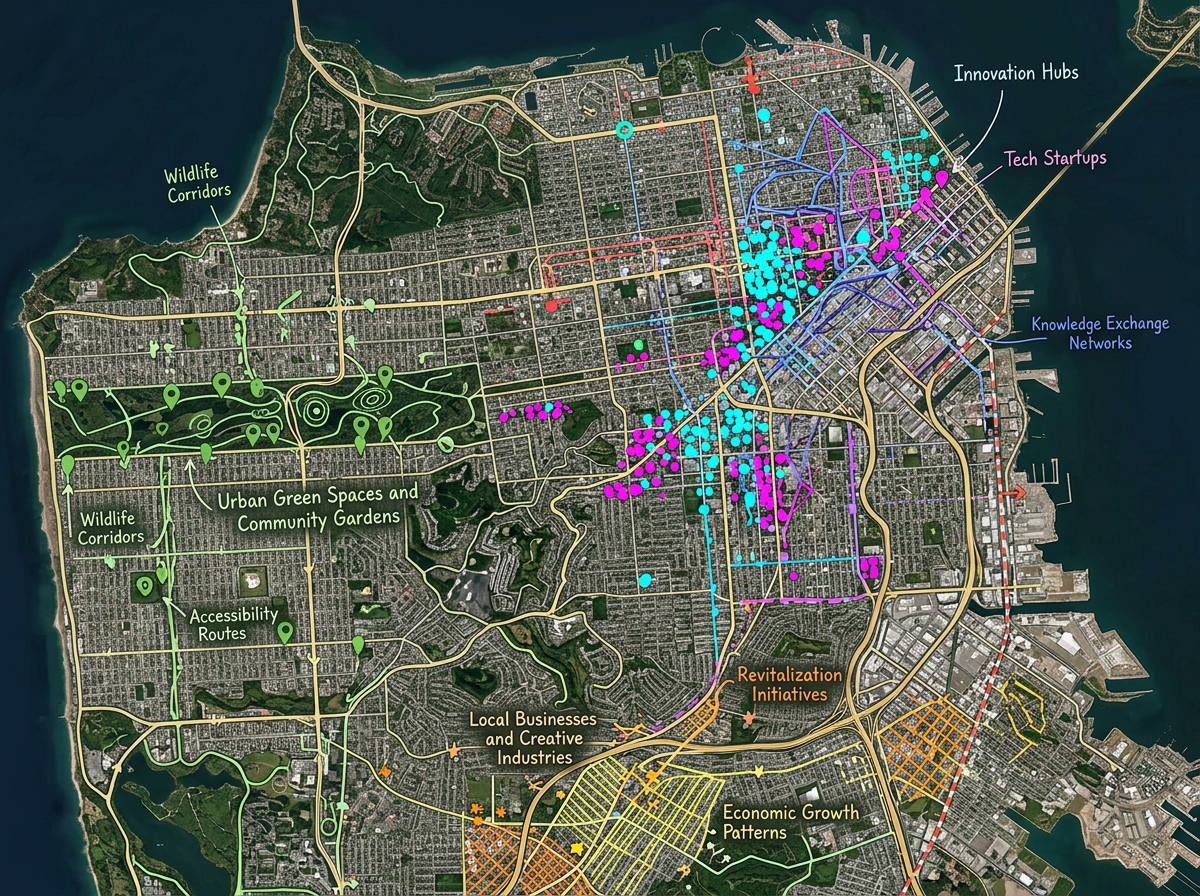
Map spreadsheet data to show patterns. Import CSV files, plot points by address, and reveal stories hidden in the numbers.
Scribble AI
告訴Scribble AI您需要什麼。試試「在每個地點周圍繪製500m緩衝區」、「匯入此CSV並依狀態著色」或「測量從倉庫到每個停靠點的路線」。幾秒鐘就能完成。無需GIS訓練,您的團隊也能取得同一張可直接分享的地圖。
試用Scribble AI →★ ★ ★ ★ ★“Scribble Maps lets our newsroom create professional maps in minutes. We used to wait days for graphics.”
★ ★ ★ ★“Great for visualizing data stories. I can import a spreadsheet and have a map ready in an hour.”
Yes. Click Share, copy the embed code, and paste it into WordPress, Medium, or any website. The map loads fast and works on all devices.
Yes. Edit your map anytime and readers see the changes right away. Perfect for breaking news that develops over time.
Yes. Import CSV files with addresses or coordinates. Scribble Maps plots the points automatically so you can visualize patterns in your data.
Yes. Scribble Maps is free to start, with paid options for larger imports and advanced features. See the pricing page for details.