

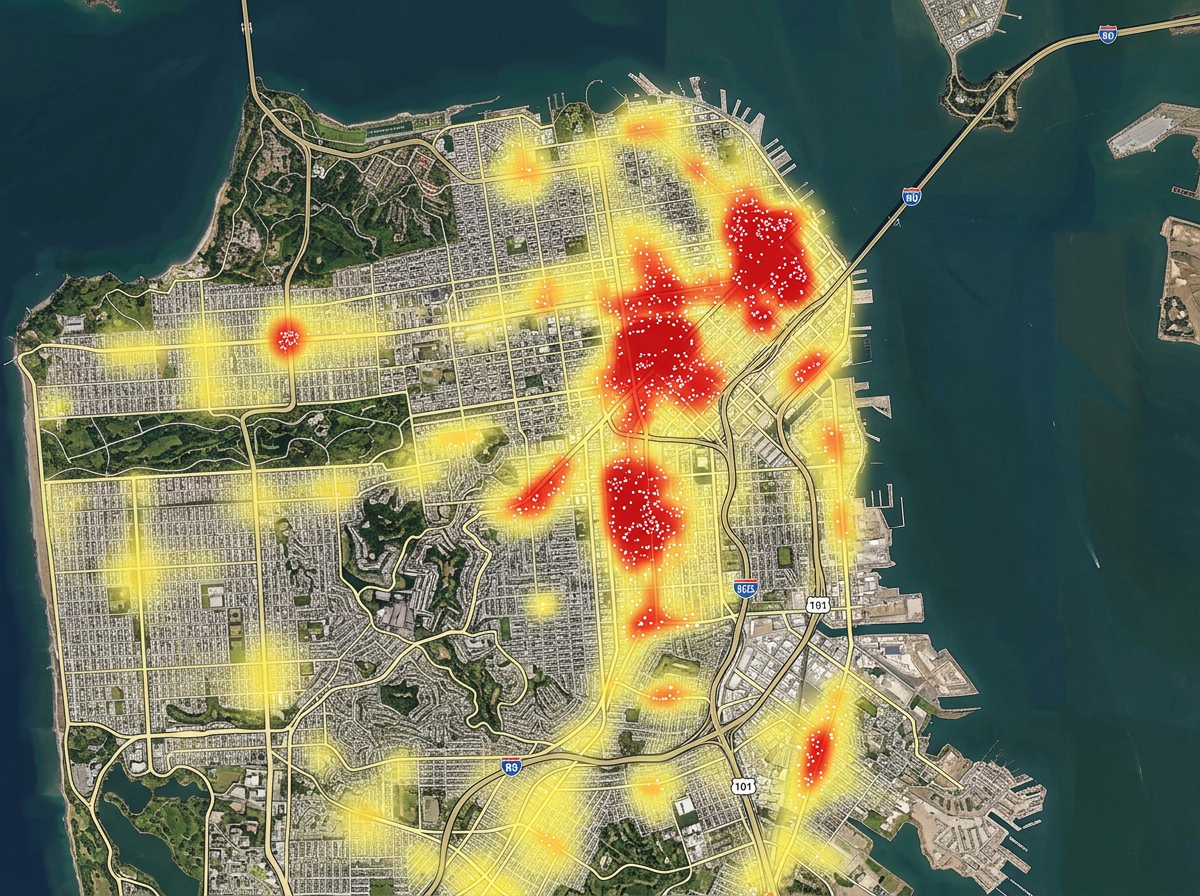
Customer concentration
Plot every customer and overlay a heatmap. See where your base is dense and where it thins out. Plan campaigns and openings around real density.

 English
 Español
 Français
 Deutsch
 Português
 日本語
 中文
 العربية
 한국어
 Italiano
 Русский
 Türkçe
 Nederlands
 Polski
 हिन्दी
 Dansk
 Čeština
 Română
 Ελληνικά
 Tiếng Việt
 Suomi
 Українська
 Indonesia
 Svenska
 Norsk bokmål
 Hrvatski
 Magyar
 Български
 中文(繁體)
 Slovenčina
 Srpski
 ไทย
 Eesti
 Català
 Lietuvių
 עברית
 Slovenščina
 فارسی
 Latviešu
 Azərbaycan
 Беларуская
 Melayu
 Bosanski
 ქართული
 Shqip
 Gaeilge
 Монгол
 ဗမာ
 O‘zbek
 اُردو
 Македонски
 ខ្មែរ
 Nynorsk
 বাংলা
 Galego
 Euskara
 Íslenska
 தமிழ்
 ລາວ
 ગુજરાતી
 Latina
 मराठी
 Қазақ тілі
 ਪੰਜਾਬੀ
 Afrikaans
 नेपाली
 አማርኛ
 తెలుగు
 ChiShona
 Cymraeg
 Føroyskt
 অসমীয়া
 Brezhoneg
 Esperanto
 Basa Jawa
 کٲشُر
 Ирон
 Sardu
Stack your customers, your competitors, demographics, and any data you have on one map. Find growth pockets, gaps, and the right next move with one clear view.
★ ★ ★ ★ ★“Prospect and constraint analysis for mobility business. Opportunely for the sales staff to utilise.”
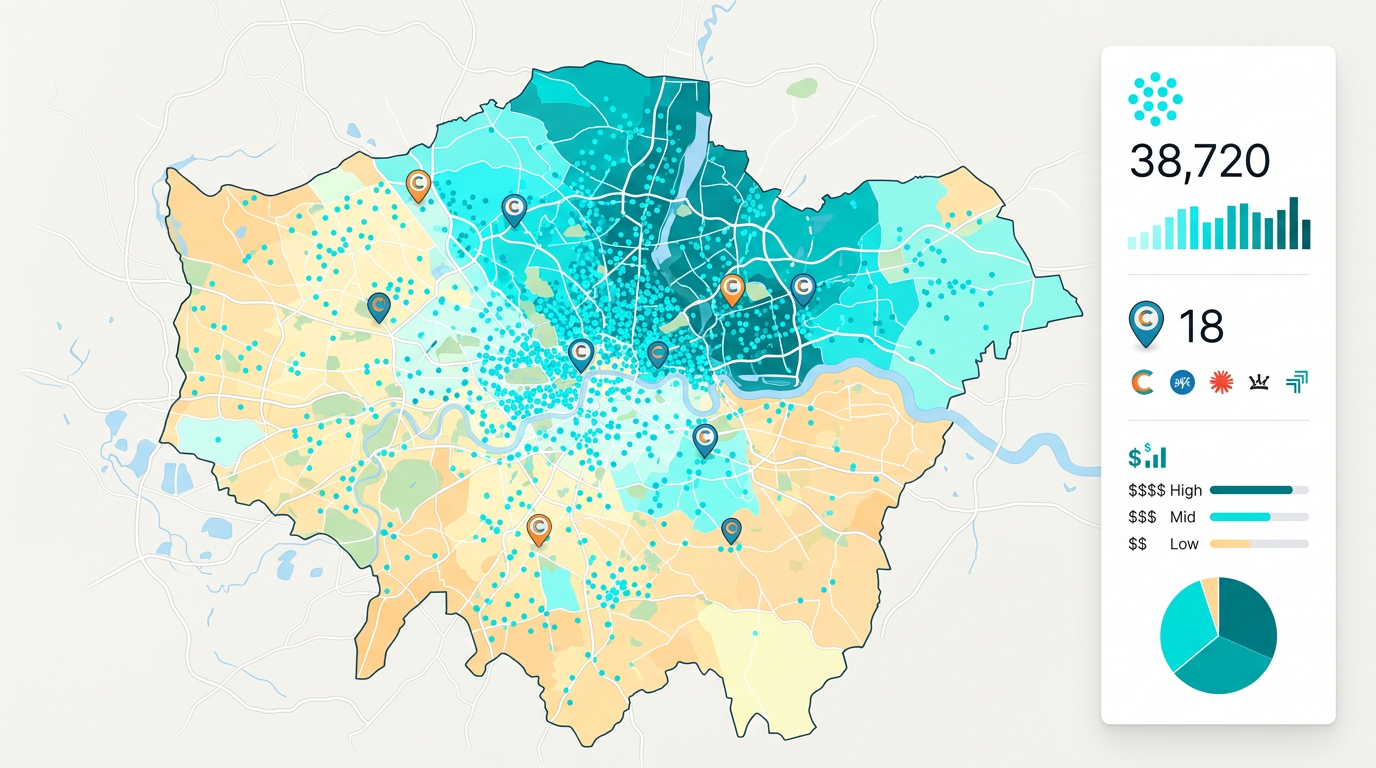
Stack your customers, sales, competitors, and demographics on one map. Toggle layers to test ideas. The pattern that matters often only shows up when you stack them.
Import sales, leads, accounts, or any list as a CSV or Excel file. Color zones by value or count and read the map like a chart.
Send a single link to your team, your board, or your investors. Embed the map in a deck. Everyone reads the same picture and the same case for action.
Plot every customer and overlay a heatmap. See where your base is dense and where it thins out. Plan campaigns and openings around real density.
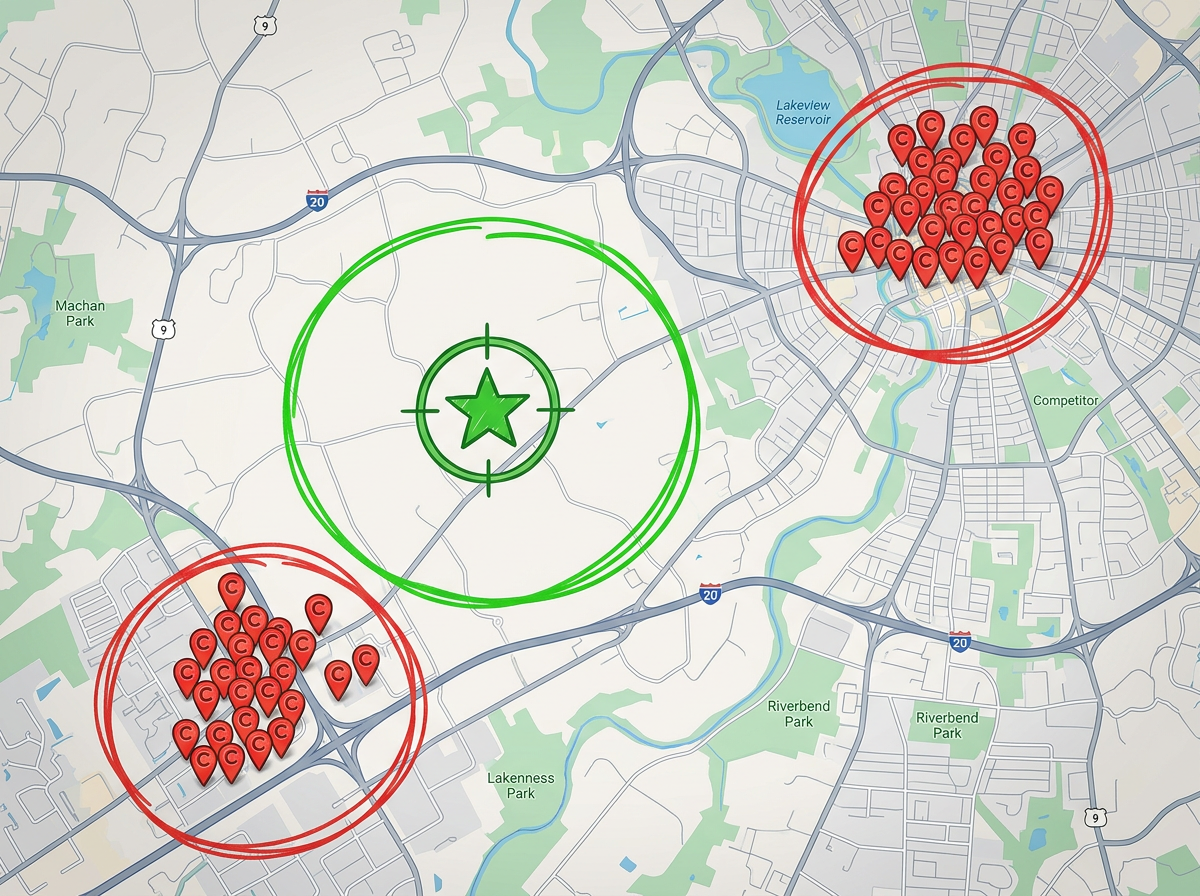
Drop competitor pins or import a list of places. See where competition is heavy, where it is light, and where you can move in fast.
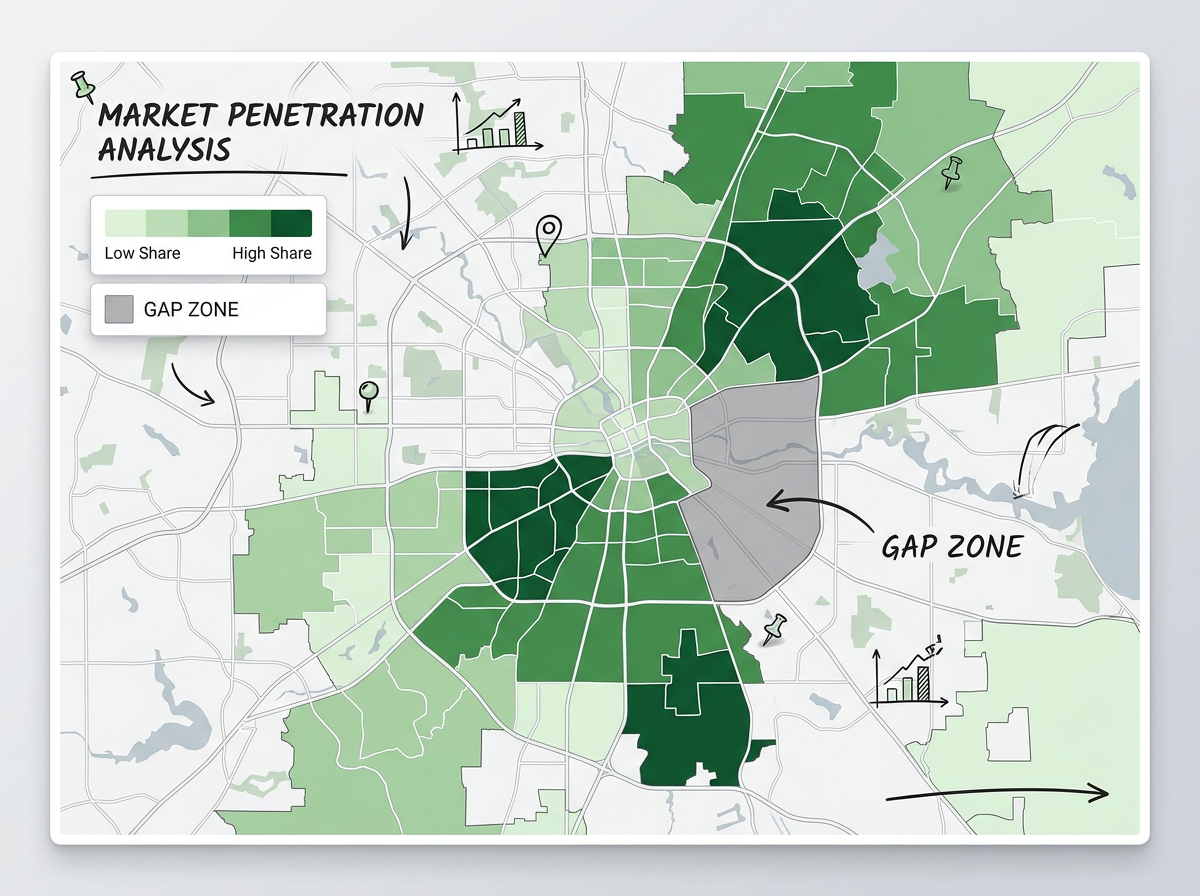
Color zip codes by your market share. Spot gaps where the population is high but your share is low. Build a target list for sales and marketing in minutes.
Scribble AI
告訴Scribble AI您需要什麼。試試「在每個地點周圍繪製500m緩衝區」、「匯入此CSV並依狀態著色」或「測量從倉庫到每個停靠點的路線」。幾秒鐘就能完成。無需GIS訓練,您的團隊也能取得同一張可直接分享的地圖。
試用Scribble AI →Market analysis on a map means stacking your customers, competitors, demographics, and other data on one map so geographic patterns become easy to read.
A list of customers or leads is a great start. Add competitor pins or a list of places. Demographics for any zip or polygon are built in, so you do not need to source them yourself.
Yes. Send one link or embed the map in a deck. Viewers pan, zoom, and tap pins. They do not need to know SQL, GIS, or any tool.
Yes. Re-import your file and the map updates. Anyone with the link sees the new picture next time they open it.
Yes. Traffic Intelligence colors every US road by daily traffic. Click a road for AADT, peak hour, and an hourly profile, and compare corridors next to your customers and competitors. Available on Pro Business.