Back
New AI agents Let Claude, ChatGPT or Gemini map for you

Know what is happening around your people and sites

The Situation & Market Intel kit puts live incidents from 19,000+ news sources on your map: riots, protests, shootings, fires, outages, and closures, down to the city. Add official travel advisories and your own offices, hotels, and routes. Brief executives with a map they open by link.

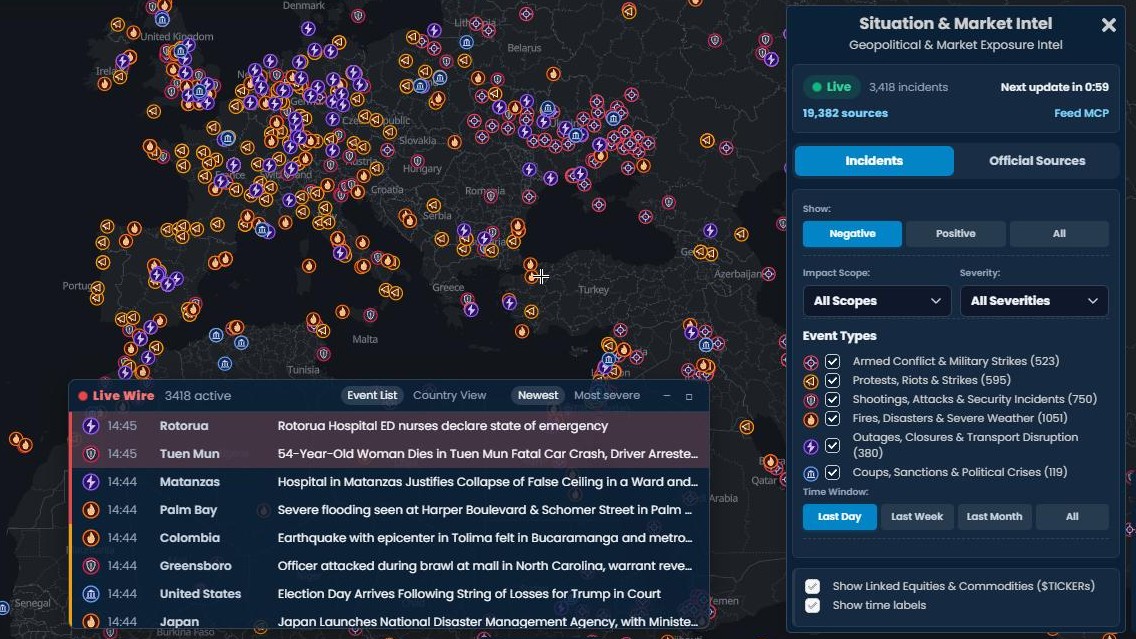
The Scribble Maps editor with the Situation & Market Intel kit open over a dark map of Europe, North Africa, and the Middle East. Incident markers by type cover the map, the Live Wire list of the latest incidents sits along the bottom, and the kit panel on the right shows the live status, the incident count, and the type, severity, scope, and time filters.
★ ★ ★ ★ ★

“Scribble Maps is one of the only software available that lets you make a fully customizable map.”

via G2

Why Scribble Maps for Security Risk Mapping

Live incidents, down to the city

We monitor 19,000+ public news sources, including local outlets in the city where something happens. Reports are grouped into one incident with a place, a severity, and an outlet count, often before the big wires pick it up.

Your people and sites on the same map

Drop your offices, hotels, venues, and routes on the map, or import them from a spreadsheet. Filter incidents by type, severity, scope, and time window to see what sits near them.

Brief executives in minutes

Share by link so leaders see the same risk picture on any device. Save an incident to the map, add your notes, and export a snapshot for the briefing deck. No account and no install needed.

Situation & Market Intel kit

A live situation tracker inside your map

Add the kit and the map fills with current incidents: armed conflict, protests and riots, shootings and attacks, fires and disasters, outages and closures, and political crises. A Live Wire lists the latest events, and an Official Sources tab adds travel advisories and official alerts for any country.

  • 19,000+ public news sources, grouped into incidents with severity, scope, and outlet count
  • One AI brief per incident: summary, timeline, status, and the impact on safety and movement
  • Travel advisories from the United States, United Kingdom, and Canada, plus USGS, GDACS, and NWS alerts
  • Feed MCP sends the live feed to Claude, ChatGPT, or your own tools
Try the kit →

Pro Business for the live feed. Any plan can use the delayed feed, 36 hours behind.

The Situation & Market Intel kit panel in Scribble Maps showing Live, the number of incidents, the next update countdown, the Incidents and Official Sources tabs, and filters for impact scope, severity, event type, and time window, over a map of Europe covered in incident markers.

Built for Security Risk Mapping teams

A Scribble Maps map of Greater London with Situation Intel incident markers for shootings, fires, and outages, and the Live Wire in Country View listing countries with their incident counts and severity icons.

Watch the cities your people travel to

Zoom to a city before a trip. See the protests, road blockades, strikes, shootings, and fires reported there, each with its place and severity. The Country View in the Live Wire lists every country with incidents and how severe they are.

A Situation Intel incident brief in Scribble Maps for a shooting near a London venue, with the type icon and country flag, a summary, key facts, a timeline, the current status, and the source report.

Read one brief instead of twenty articles

Click More info on an incident for a brief built from every report about it: what happened, a timeline, the current status, and what it means for safety and movement. Claims that conflict or are not confirmed are flagged. The reports it drew on are listed at the end.

The Official Sources tab of the Situation & Market Intel kit in Scribble Maps with Colombia selected, showing Level 3 and Level 2 travel advisories from the United States, United Kingdom, and Canada, over a map of Colombia with incident markers.

Check official travel advisories

Open the Official Sources tab and pick a country, or use the map center. Read the current travel advisories from the United States, United Kingdom, and Canada, each with its level and a link to the full text. Official alerts for earthquakes, disasters, and severe weather sit below them and can be added to the map.

A Scribble Maps map of Bogota with the user's own markers for a hotel, a venue, and an office next to live fire incident markers, and the data table below listing those markers and the incidents with their type, severity, scope, status, and place.

Add your own sites and incidents

Place offices, hotels, and venues on the map, or import them from a spreadsheet. Save a live incident to the map and add your own incident reports. The data table lists your markers and the live incidents together, with the incident type, severity, scope, status, and place, and filters them to what is in view.

Features that matter

  • Live incidents from 19,000+ public news sources worldwide
  • Six incident types, from armed conflict to outages and closures
  • Severity, impact scope, place, and outlet count on every incident
  • AI brief per incident with a timeline, status, and safety impact
  • Live Wire with Event List and Country View, sorted by newest or most severe
  • Travel advisories from the United States, United Kingdom, and Canada
  • USGS earthquakes, GDACS disasters, and US National Weather Service alerts
  • Import your sites and incidents from spreadsheets, CSV, KML, GeoJSON, and Shapefile
  • Draw zones, buffers, and boundaries around your sites
  • Filters and a data table across your markers and the live incidents
  • Share by link with live updates, or export to PDF, PNG, KML, or GeoJSON
  • AES-256 encryption and private sharing for sensitive maps
  • Feed MCP for Claude, ChatGPT, and your own tools
  • Works on laptop, tablet, and phone

Scribble AI

Build maps with plain English

Tell Scribble AI what you need. Try “draw a 500m buffer around every site,” “import this CSV and color by status,” or “measure the route from the depot to each stop.” It does it in seconds. No GIS training needed, and your team gets the same map, ready to share.

Try Scribble AI →

Frequently asked questions

What is security risk mapping?

Security risk mapping is plotting incidents, threats, and your own assets on a map so you can see where risk is concentrated. Scribble Maps combines your own data with the Situation & Market Intel kit, a live feed of incidents from public news sources, plus official travel advisories and alerts.

What is the Situation & Market Intel kit?

It is a Scribble Maps kit that puts live incidents from around the world on your map. Each incident shows where it happened, how severe it is, how many outlets reported it, and an AI brief of what is known. An Official Sources tab adds government travel advisories and official alerts. The live feed needs Pro Business. Any plan can use the delayed feed, 36 hours behind.

Which incidents does it track?

Six types: armed conflict, protests and riots, shootings and attacks, fires and disasters, outages and closures, and political crises such as coups, sanctions, and border closures. Strikes, severe weather, and transport disruption are included too. Turn each type on or off in the kit panel.

Can I import my own incident and asset data?

Yes. Import a spreadsheet, CSV, KML, GeoJSON, or Shapefile. Your sites and incidents land on the map by address or coordinates, and you can color them by severity. Live incidents can be saved to the map as regular markers next to them.

Can executives view the map without an account?

Yes. Share a link and anyone can open the map in a browser. No account, no install, and no training needed. You can also export a snapshot for a slide deck.

Can I rely on it for safety or travel decisions?

Use it as an awareness tool, not as your only source. Coverage is automated, so incidents can be missed, reported late, or shown in the wrong place, and no incident on the map does not mean an area is safe. Always check official advisories, local authorities, and your security provider.

Is the data secure?

Yes. Maps support AES-256 encryption and private sharing. Keep sensitive risk maps locked to your team and share a link only with the people who need it.

Do I need GIS training to use it?

No. Add the kit from the Kits tab, pick a marker, set the location, and choose a color for severity. The map builds as you go, and Scribble AI can plot and style data for you on request.

See what is happening around your people today

We use cookies to enhance your experience. By continuing to visit this site you agree to our use of cookies. Privacy Policy