Back
New AI agents Let Claude, ChatGPT or Gemini map for you

Live incidents worldwide, and the markets they may move

See riots, attacks, fires, disasters, outages, and political crises on your map in real time, often 2 to 3 days or more before other providers report them. Check official travel advisories and alerts for any country, and see which stocks and commodities each event may affect. All in the map editor you already use.

G2 4.7 / 5 · 200 reviews on G2
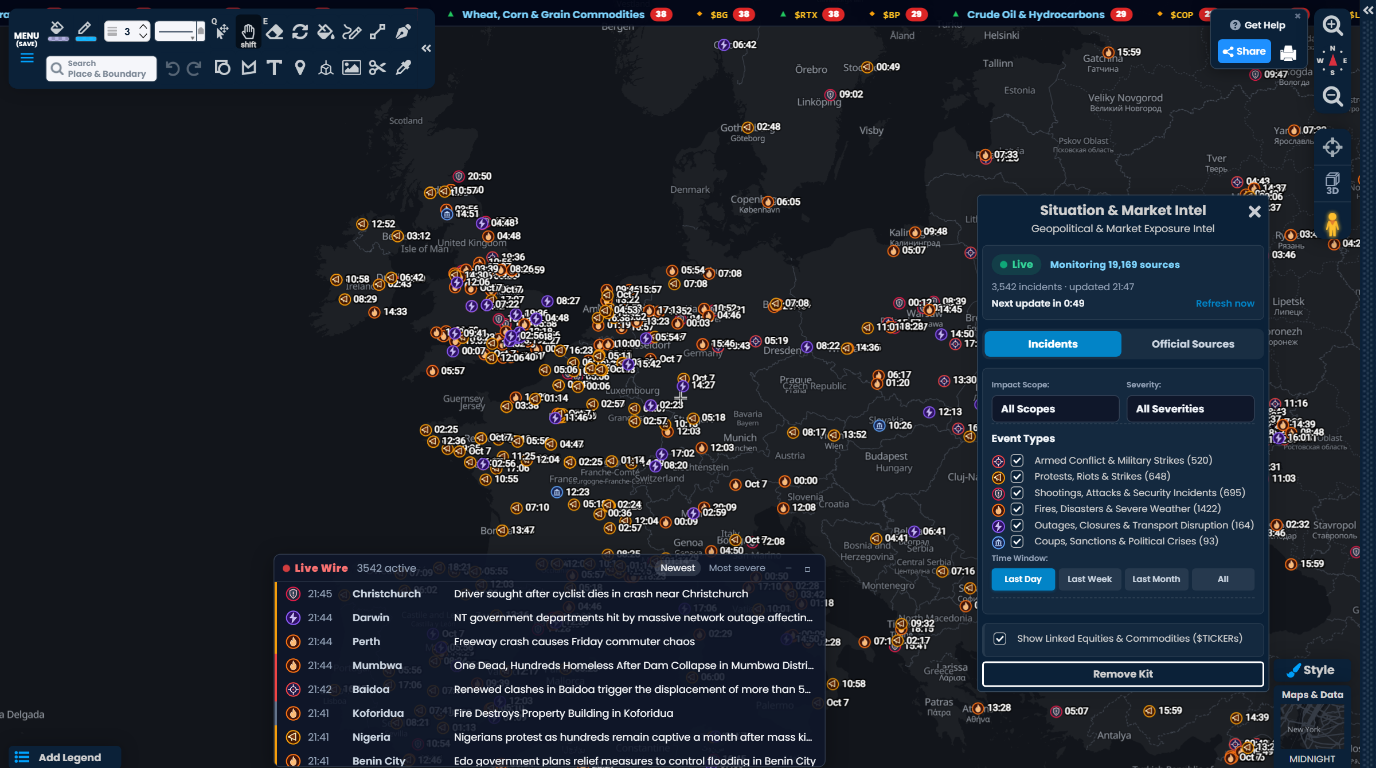
A Scribble Maps map of Europe on a dark base with live incident markers by type, the Live Wire list of the latest incidents worldwide, the Situation & Market Intel panel with its filters, and a ticker of affected stocks and commodities across the top.
★ ★ ★ ★ ★

“Scribble Maps is one of the only software available that lets you make a fully customizable map.”

via G2

Why Scribble Maps for Situation & Market Intel

City level, not just headlines

Each incident is pinned to the place it happened, with its type, severity, and how many outlets reported it. See a riot, a fire, or a road closure in the city your team is heading to, not just a country that is in the news.

Official sources one click away

Pick a country to read the US, UK, and Canadian travel advisories side by side, with their level from 1 to 4. Add official earthquake, disaster, and severe weather alerts to the same map.

See the market angle

A ticker lists the stocks and commodities that current incidents may affect, each marked as a likely tailwind, a likely headwind, or mixed. Hover an item to see the incidents behind it.

Built for Situation & Market Intel teams

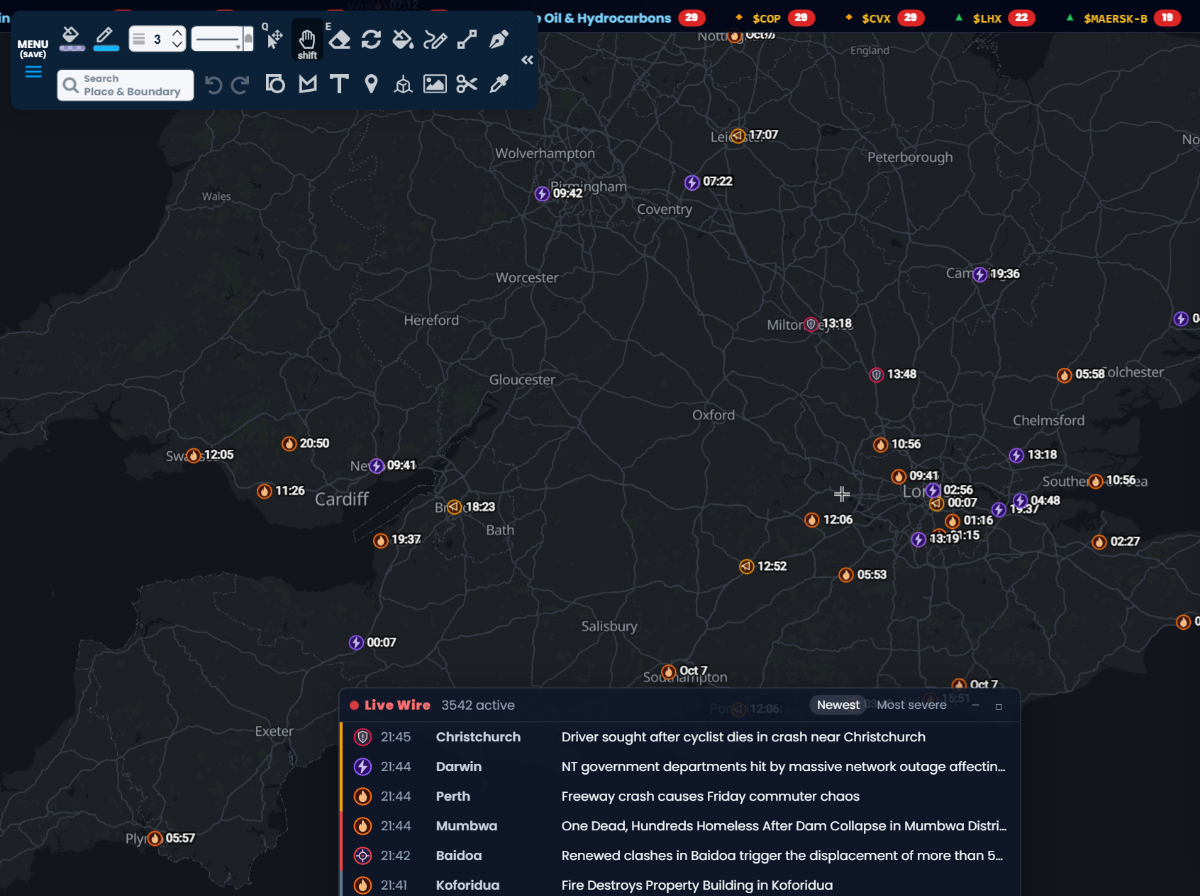
A Scribble Maps map of southern England with live incident markers by type and the Live Wire list of the latest incidents along the bottom of the map.

Watch incidents as they are reported

Turn on the kit and incidents appear on the map by type: armed conflict, protests and riots, shootings and attacks, fires and disasters, outages and closures, and political crises. The Live Wire lists the latest ones. Click a row to fly to it.

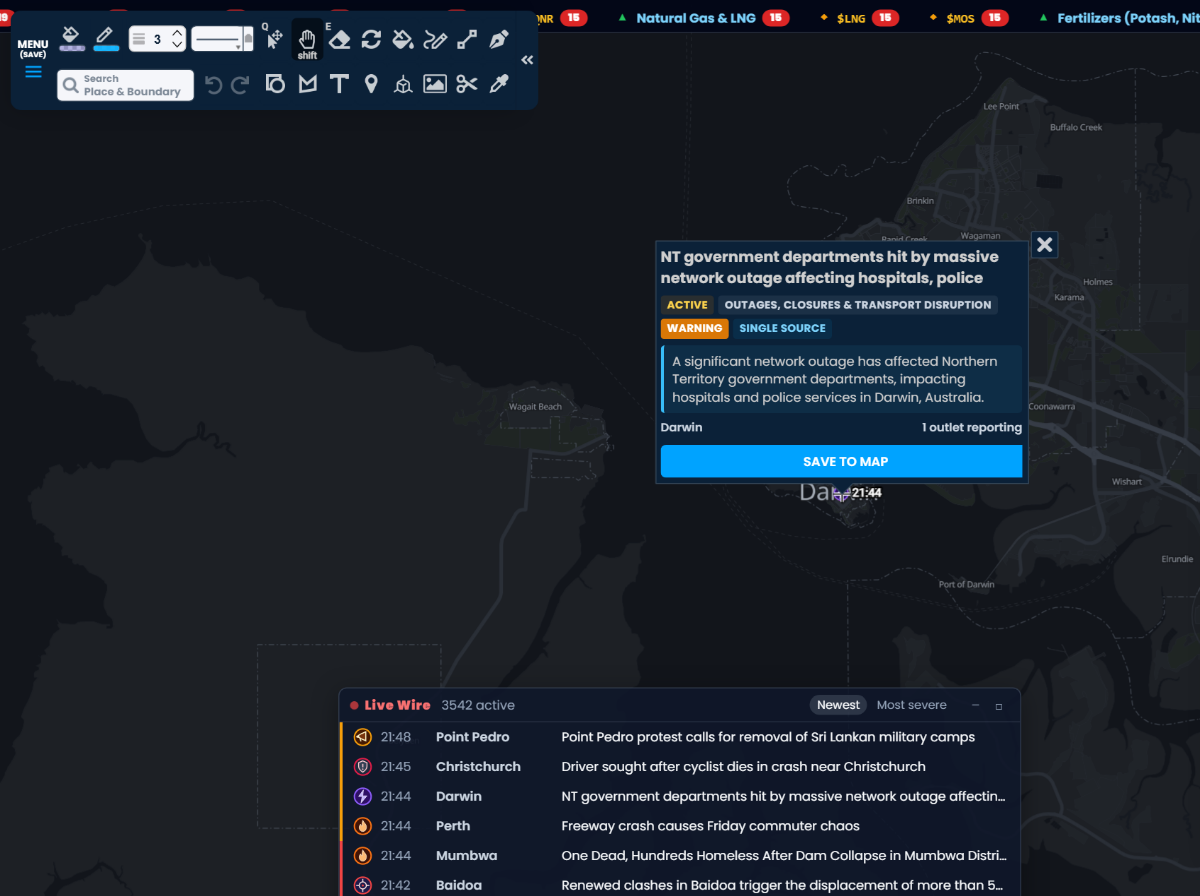
A Situation Intel incident report in Scribble Maps on a network outage affecting hospitals and police in Darwin, Australia, showing its status, type, severity, a short summary, the outlet count, and a Save to map button.

Click any incident for the full story

See the headline, a short summary, the place, the incident type, how severe it is, whether it is still active, and how many outlets reported it, with major outlets named. Click Save to map to keep it on your map as a regular marker.

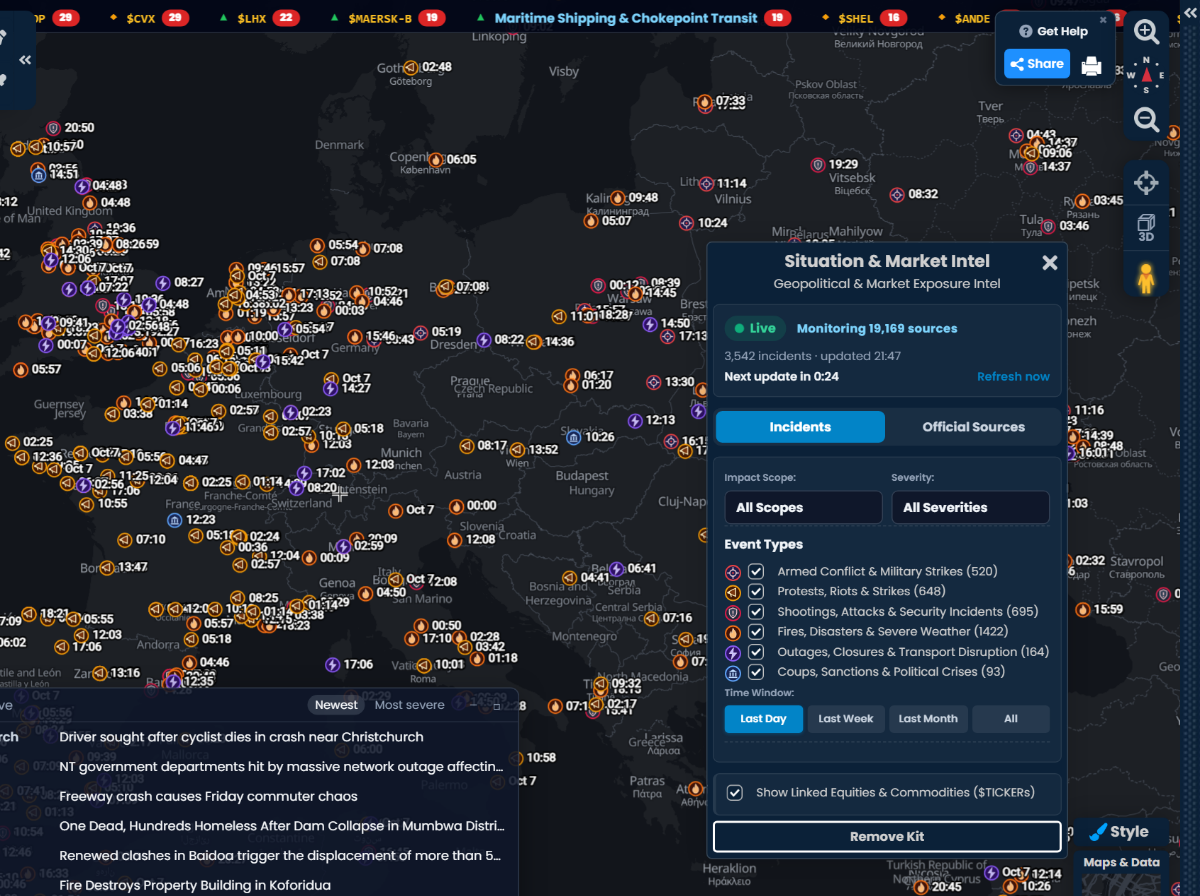
The Situation & Market Intel kit panel in Scribble Maps with impact scope, severity, event type, and time window filters over a map of live incidents.

Filter to what matters to you

Show only critical incidents, only city level events, or only the types you track. Pick the last day, week, or month. The panel counts the matching incidents and the map updates by itself.

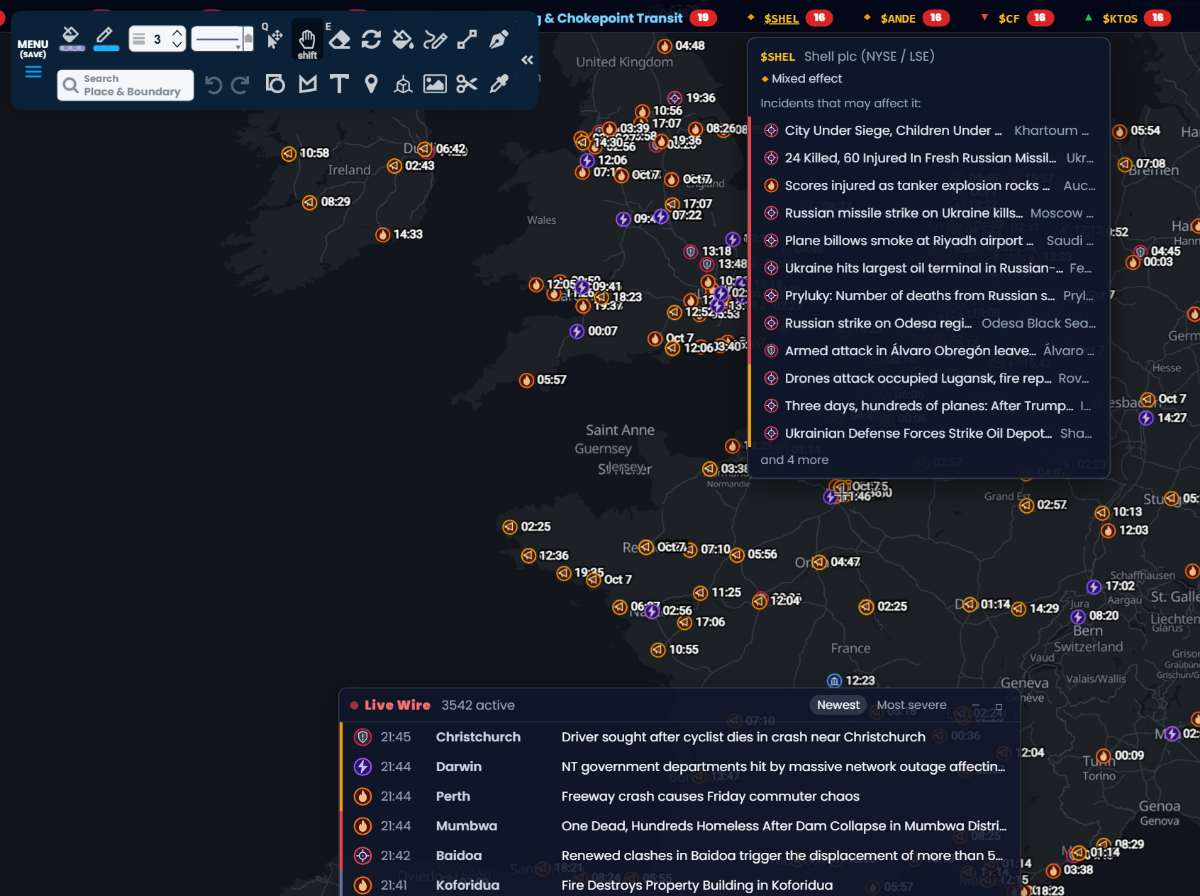
The Situation Intel ticker in Scribble Maps with Shell plc open, marked as a mixed effect, and the list of incidents that may affect it.

See which stocks and commodities may be affected

The ticker across the top of the map lists the companies and commodities linked to current incidents. Hover one to see the incidents behind it, then click an incident to go to it on the map.

★ ★ ★ ★ ★ “Fantastic tool for market and sales analysis. Offers a visual layout of customer and competitor locations in a given geographical region.” — Bill C. Market analyst

Features that matter

  • Real-time incidents from public news sources around the world
  • Often 2 to 3 days or more ahead of other providers
  • Six incident types, from armed conflict to outages and closures
  • Severity, impact scope, place, and outlet count on every incident
  • Filters for type, severity, impact scope, and time window
  • Live Wire list of the latest incidents, sorted by newest or most severe
  • Ticker of the stocks and commodities incidents may affect
  • US, UK, and Canadian travel advisories for any country
  • Official earthquake, disaster, and severe weather alerts on the map
  • Save any incident to your map as a regular marker
  • Ask Scribble AI about incidents near a place or a stock
  • Included with Pro Business, no separate data contract

Scribble AI

Build maps with plain English

Tell Scribble AI what you need. Try “draw a 500m buffer around every site,” “import this CSV and color by status,” or “measure the route from the depot to each stop.” It does it in seconds. No GIS training needed, and your team gets the same map, ready to share.

Try Scribble AI →

Frequently asked questions

What is Situation & Market Intel?

It is a Scribble Maps kit that puts live incidents from around the world on your map. Each incident shows where it happened, how severe it is, how many outlets reported it, and which stocks and commodities it may affect. An Official Sources tab adds government travel advisories and official alerts for any country.

What kinds of incidents does it show?

Six types: armed conflict, protests and riots, shootings and attacks, fires and disasters, outages and closures, and political crises such as coups and sanctions. Strikes, severe weather, and transport disruption are included too. Turn each type on or off in the kit panel.

Where does the incident data come from?

Incidents are collected automatically from public news sources and grouped so one event shows once, with a count of the outlets that reported it. Major outlets are named; local outlets show as Local Source. Official alerts come from USGS for earthquakes, GDACS for disasters, and the US National Weather Service for severe weather. Travel advisories come from the governments of the United States, the United Kingdom, and Canada.

Who uses it?

Security and travel risk teams use it to watch the cities their people are traveling to. Operations and supply chain teams use it to spot fires, closures, and outages near their sites. Analysts and investors use it to see which companies and commodities a world event may touch.

Can I rely on it for safety or travel decisions?

Use it as an awareness tool, not as your only source. Coverage is automated, so incidents can be missed, reported late, or shown in the wrong place, and no incident on the map does not mean an area is safe. Always check official advisories, local authorities, and your security provider.

How are incidents linked to stocks and commodities?

Each incident lists the companies and commodities it may affect, marked as a likely tailwind, a likely headwind, or a mixed effect. The ticker gathers them in one place. It is for research and awareness only. It is not investment, trading, or financial advice.

How current is it?

It is real time. New incidents appear on the map as they are reported, often 2 to 3 days or more before other providers pick them up. The kit refreshes by itself while it is open, and you can click Refresh now at any time. The live incidents are not saved with your map, so the map always shows the latest incidents when you open it. Incidents you keep with Save to map stay as regular markers.

Which plan do I need?

Real-time incidents are part of the Pro Business plan, with longer time windows. On any plan, open the free Delayed feed to see every incident worldwide, 36 hours behind.

See what is happening around your people and sites today

See Live Incidents