 English
 Español
 Français
 Deutsch
 Português
 日本語
 中文
 العربية
 한국어
 Italiano
 Русский
 Türkçe
 Nederlands
 Polski
 हिन्दी
 Dansk
 Čeština
 Română
 Ελληνικά
 Tiếng Việt
 Suomi


Look up the FEMA flood zone for a property
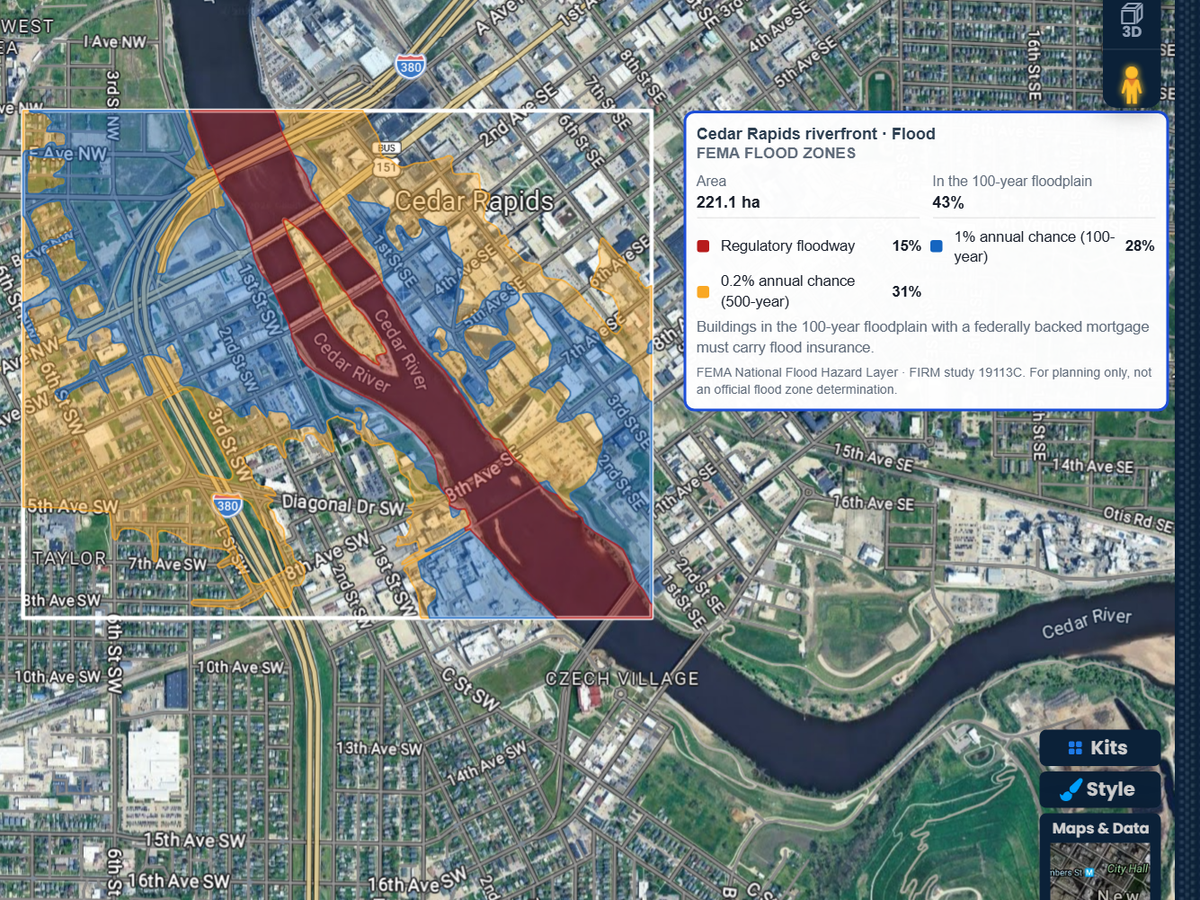
Find the address, outline the lot or the block, and read its FEMA flood zones. Each zone is drawn on the map and listed with its share of the area, its base flood elevation and the FIRM study it comes from.

Search an address, outline the property or the neighborhood, and get FEMA flood zones, the 100-year floodplain and base flood elevations on your map. Then drag a slider to raise the water on detailed terrain. Your first 3 runs are free.
 4.7 / 5 · 200 reviews on G2
★ ★ ★ ★ ★“I am a realtor, and this software has made it super easy to create a customizable map to share with our clients to map out our next territories.”
See the floodway, the 100-year and 500-year floodplains, coastal high hazard areas and levee areas, each in its own color. The report shows how much of the area sits in the 100-year floodplain.
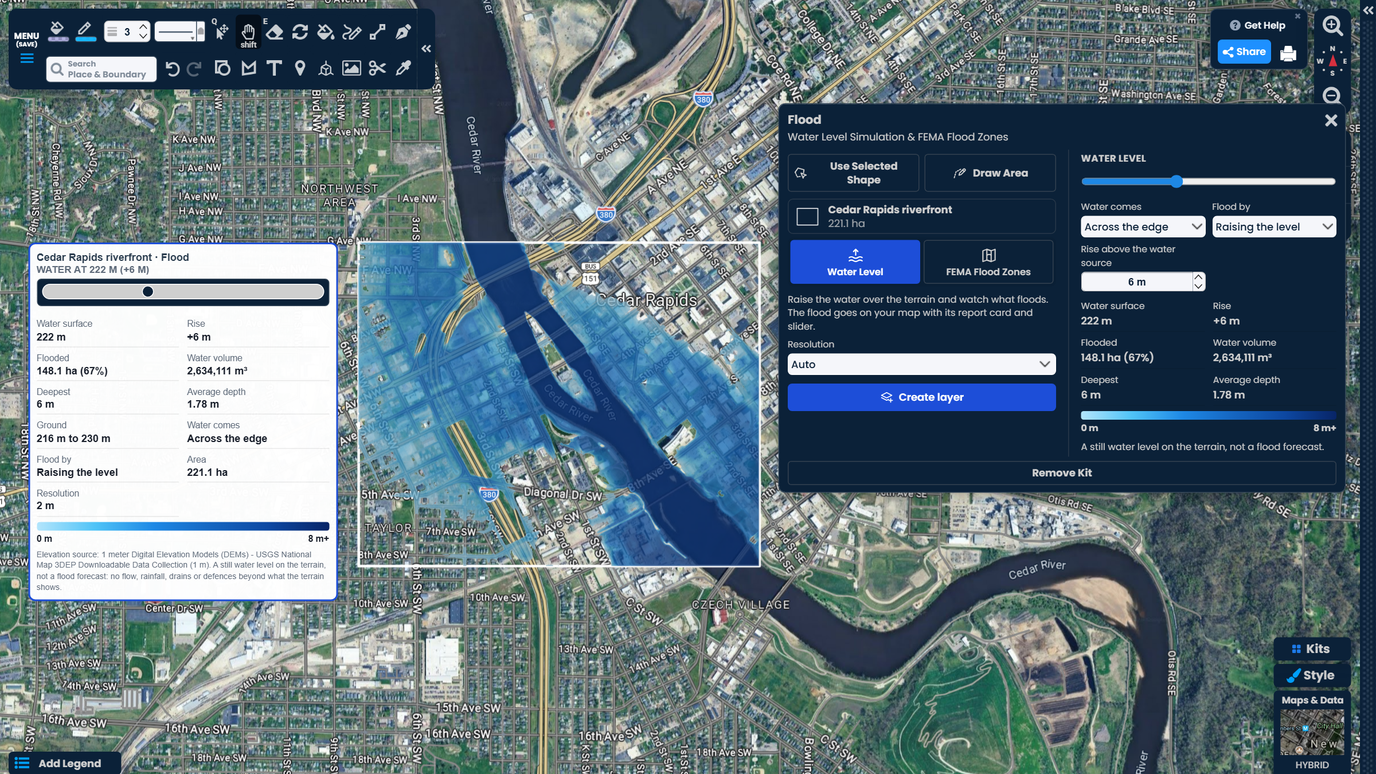
Drag one slider and the water climbs over the terrain right away. See which streets and lots go under first, how deep the water gets, and how much ground floods.
The flood zones and the water level go on your map with a report card. Share it by link with a client, a buyer or your team. No GIS software needed.
Find the address, outline the lot or the block, and read its FEMA flood zones. Each zone is drawn on the map and listed with its share of the area, its base flood elevation and the FIRM study it comes from.
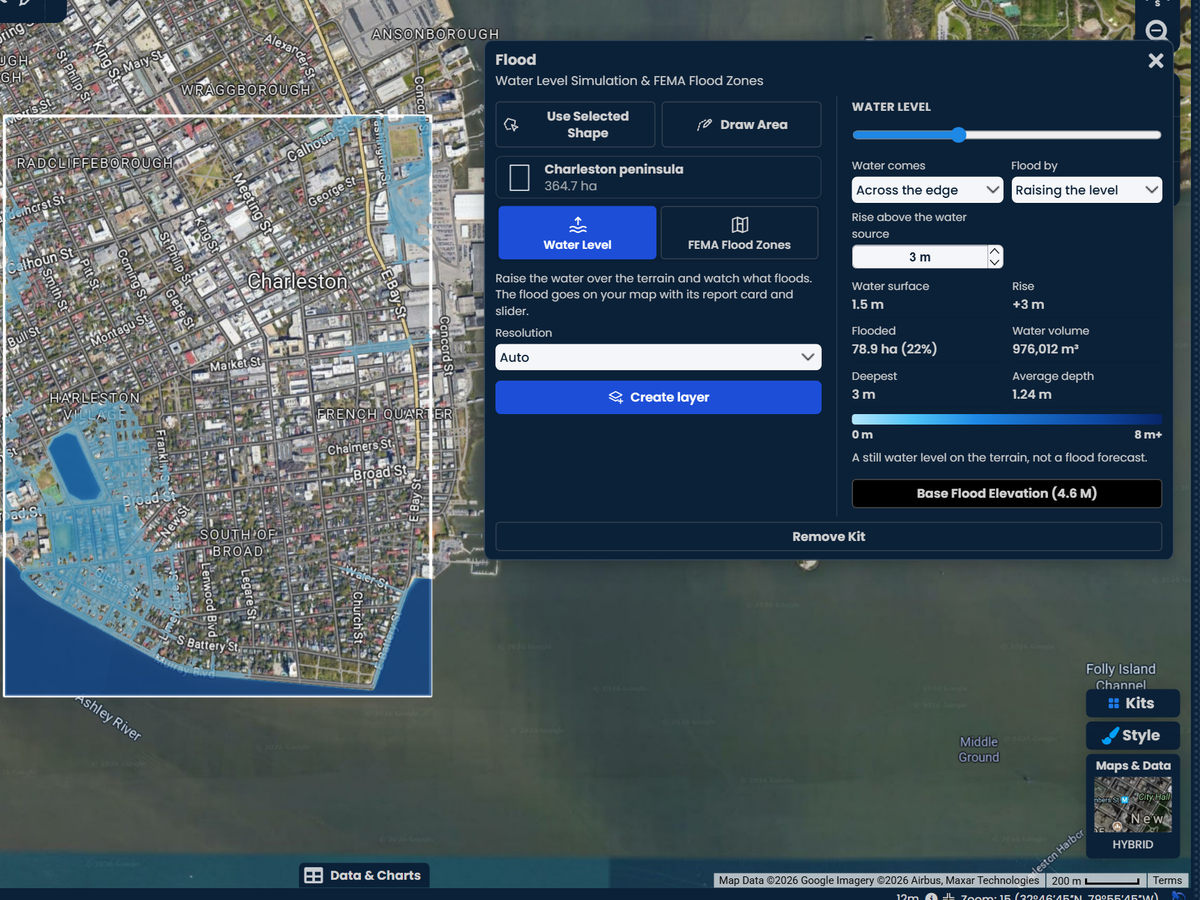
Move the slider to set the water level. The kit shows the flooded ground, the deepest point, the average depth, the water volume and the share of the area under water as you move it.
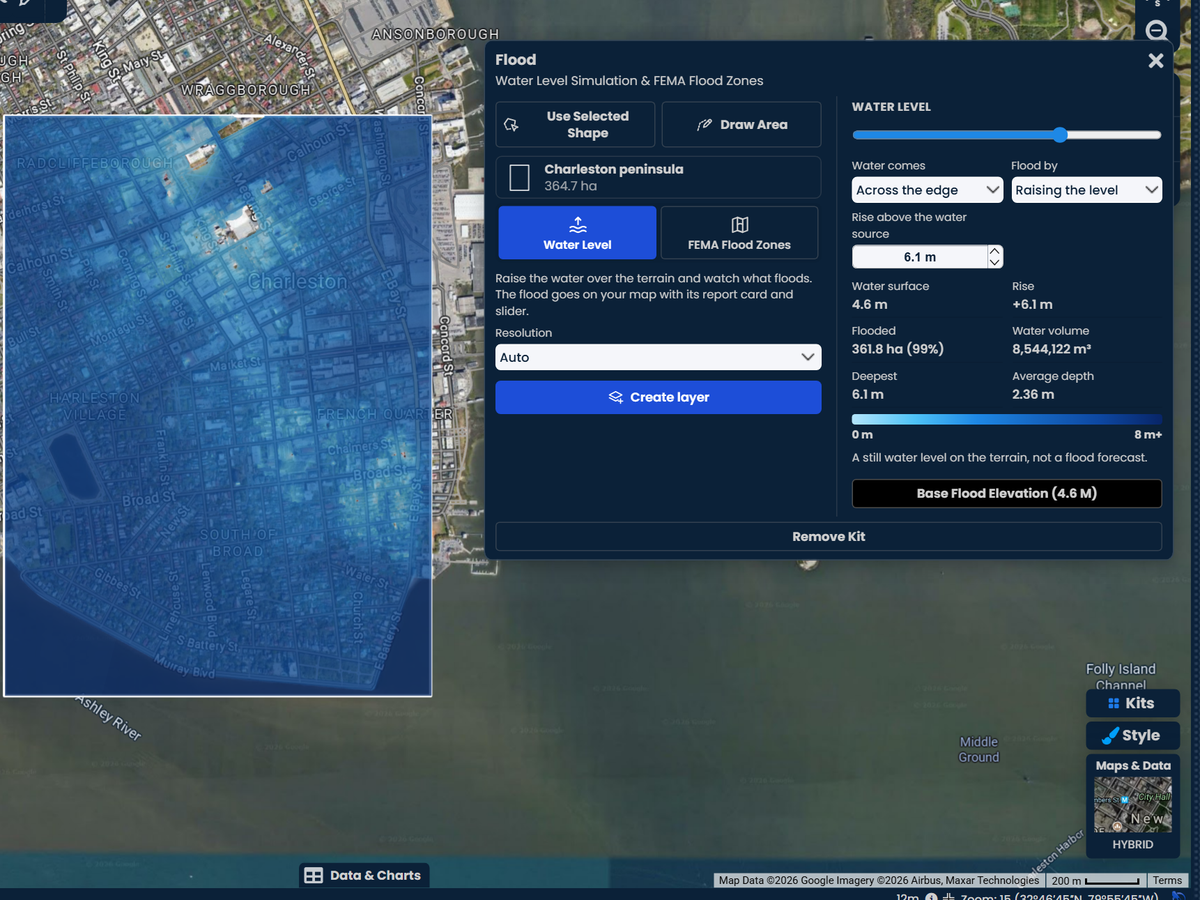
After you read the FEMA zones, one click sets the water to the highest base flood elevation FEMA lists for the area. See the ground that level would cover, lot by lot, on detailed terrain.
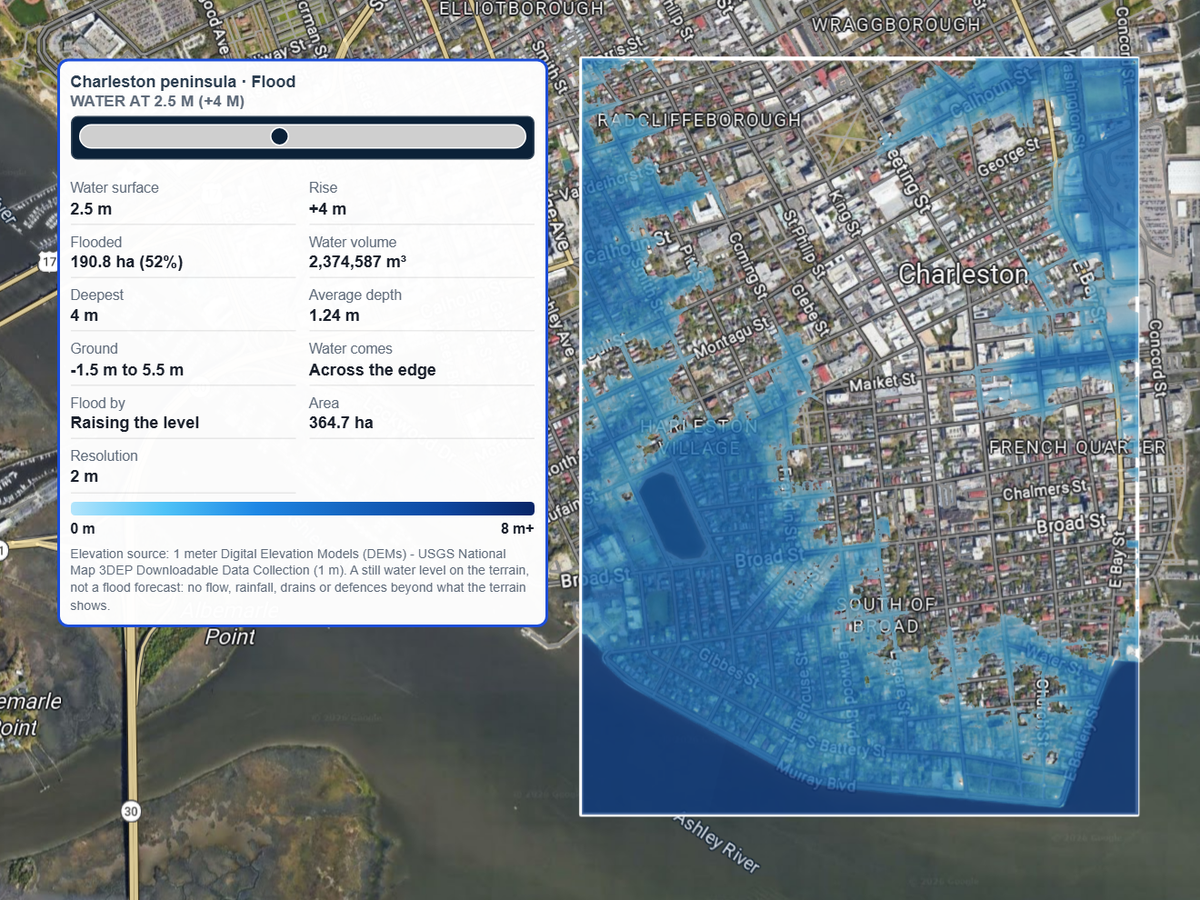
Let the water come in across the edge of the area, like a river or the sea at a set height, and raise it step by step. Or pick a marker where water enters, such as a creek or a drain, and watch it spread from there.
Scribble AI
Tell Scribble AI what you need. Try “draw a 500m buffer around every site,” “import this CSV and color by status,” or “measure the route from the depot to each stop.” It does it in seconds. No GIS training needed, and your team gets the same map, ready to share.
Try Scribble AI →Pro Business
$100 per month
Open the Flood kit, search the address, and outline the property or the area around it. Choose FEMA flood zones and run it. The zones are drawn on the map, and the report lists each zone, its share of the area and its base flood elevation.
The zones come from FEMA's National Flood Hazard Layer, the data behind FEMA's flood maps (FIRMs). The report names the FIRM study the zones come from, so you can check it against FEMA's own map.
No. It is for planning and research. Lenders and insurers use an official flood zone determination for a mortgage or a policy. Use Scribble Maps to see the risk, explain it to a client, and decide where to look closer.
Zones that start with A, like AE, are in the 100-year floodplain: land with a 1% chance of flooding each year. Zones that start with V, like VE, are coastal areas that also face storm waves. Shaded Zone X is the 500-year floodplain, or land protected by a levee. Unshaded Zone X has minimal flood hazard. The kit names each zone in plain words.
Buildings in the 100-year floodplain with a federally backed mortgage must carry flood insurance. The report marks how much of the area falls in that floodplain.
The kit loads the terrain for your area once. As you move the slider, the water fills the ground it can reach from its source, such as the edge of the area or a marker you pick. It is a still water level on the terrain, not a flood forecast: it does not model rainfall, flow speed, drains or flood walls the terrain does not show.
Yes, as a still water level. Let the water come in across the edge of a coastal area and raise it to the height you want to test. The map shows what ground sits below that level and is connected to the water.
FEMA flood zones cover the United States, though some counties have no FEMA flood map. The water level simulation works anywhere, on 1 m lidar terrain across much of the US and 30 m terrain elsewhere.
Every signed-in account gets 3 free flood runs. After that the Flood kit is part of Pro Business, at $100 a month or $90 a month billed yearly, with a free 7-day trial for eligible first-time subscribers.