 English
 Español
 Français
 Deutsch
 Português
 日本語
日本語
 中文
中文
 العربية
 한국어
한국어
 Italiano
 Русский
 Türkçe
 Nederlands
 Polski
 हिन्दी
 Dansk
Dansk
 Čeština
 Română
 Ελληνικά
 Tiếng Việt
 Suomi
Suomi


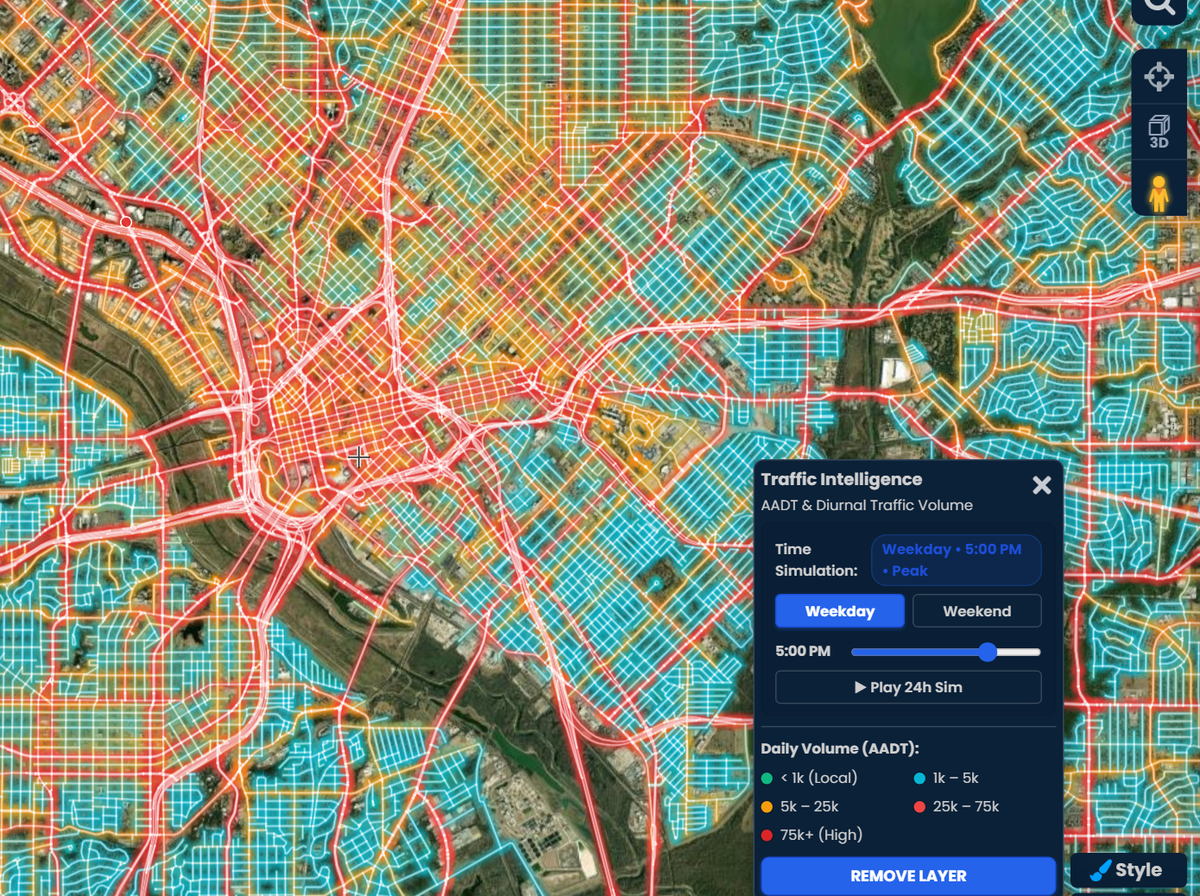
See traffic on every road at once
Turn on Traffic Intelligence and every road lights up by daily volume, from quiet local streets to busy interstates. Spot the busiest corridors in a city in seconds.

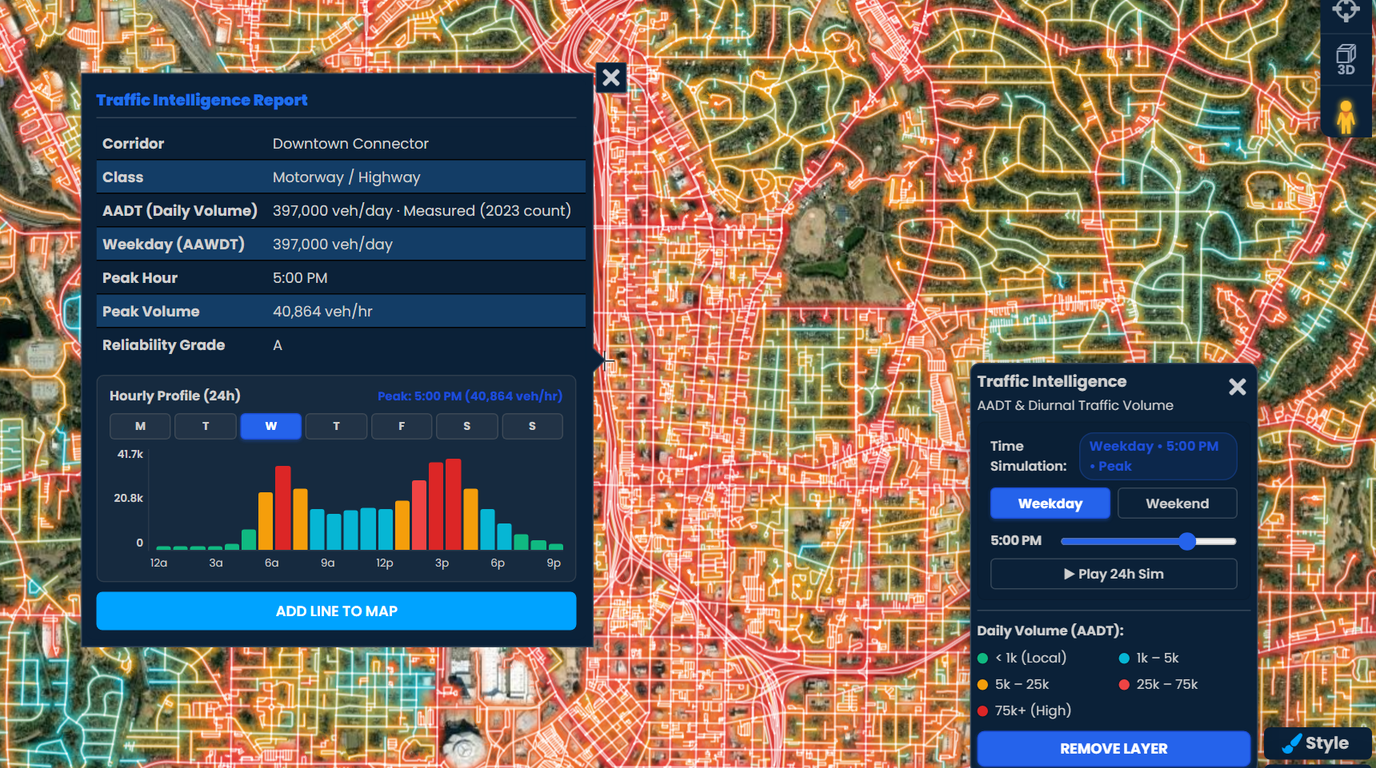
Click any road to see how many vehicles use it each day, when it peaks, and how traffic moves hour by hour. Official DOT counts where they exist, graded estimates everywhere else. No data contract, no sales call, no per-study fees.
 4.7 / 5 · 200 reviews on G2
★ ★ ★ ★ ★“Fantastic tool for market and sales analysis. Offers a visual layout of customer and competitor locations in a given geographical region.”
Traffic counters cover only a small share of roads. Scribble Maps shows the official count where one exists and fills every other road with an estimate, so you never hit a blank spot on the map.
Every road carries a reliability grade. Estimates show a low to high range and their expected error. Measured roads show the year of the count. No black box.
See traffic next to your sites, customers, and drive times in the same map editor you already use. No separate data license, no GIS desk, no waiting on a report.
Turn on Traffic Intelligence and every road lights up by daily volume, from quiet local streets to busy interstates. Spot the busiest corridors in a city in seconds.
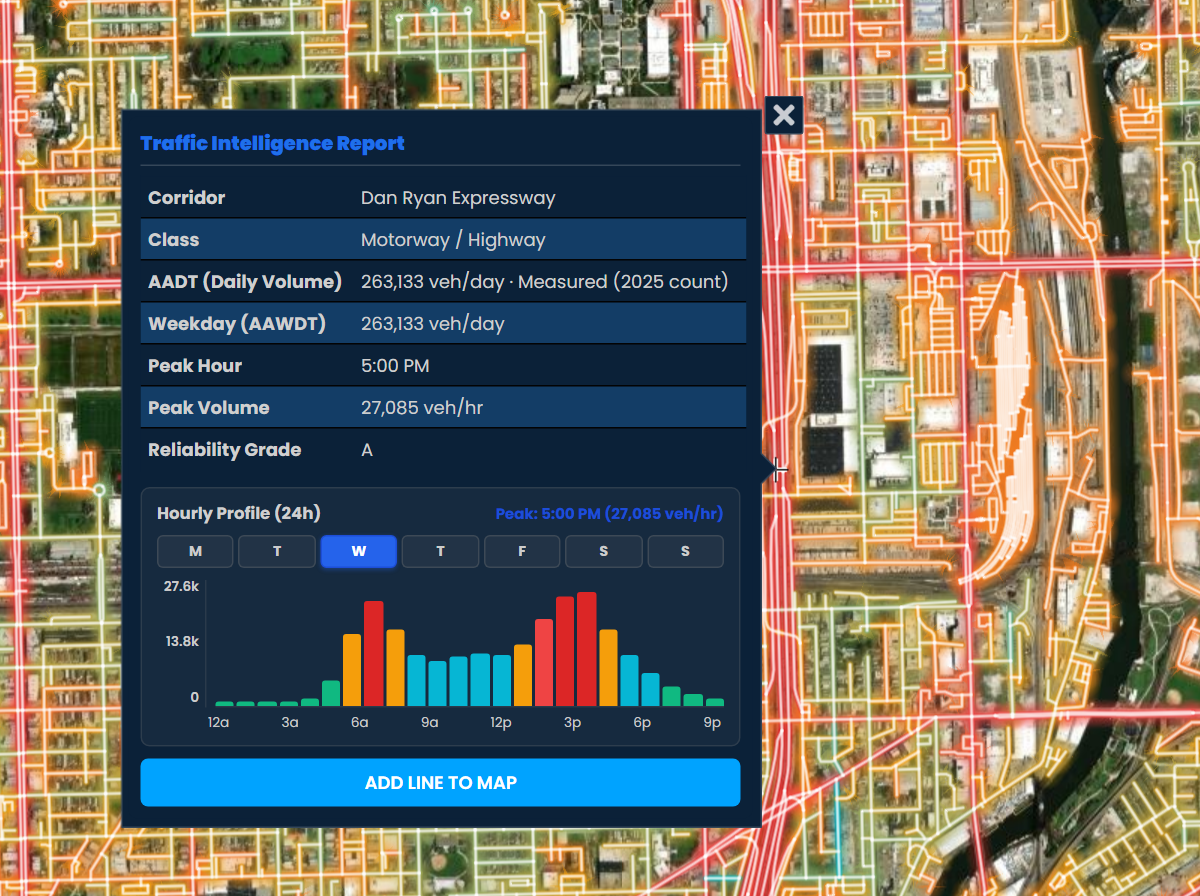
Get AADT, weekday traffic (AAWDT), peak hour, peak hourly volume, and a reliability grade. A chart shows the typical traffic for each hour of each day of the week.
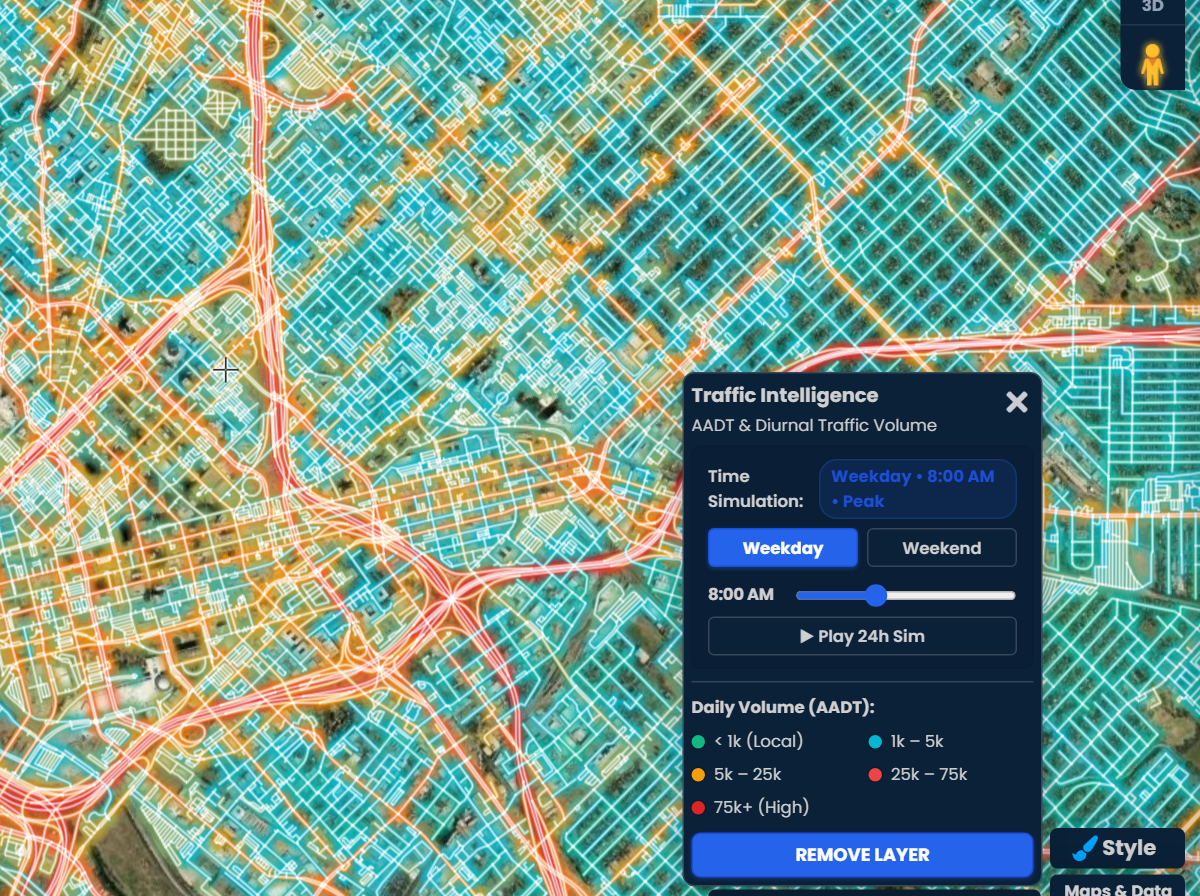
Drag the time slider or play a 24 hour simulation. Switch between weekday and weekend to see the morning rush, the evening peak, and the quiet hours on every road.
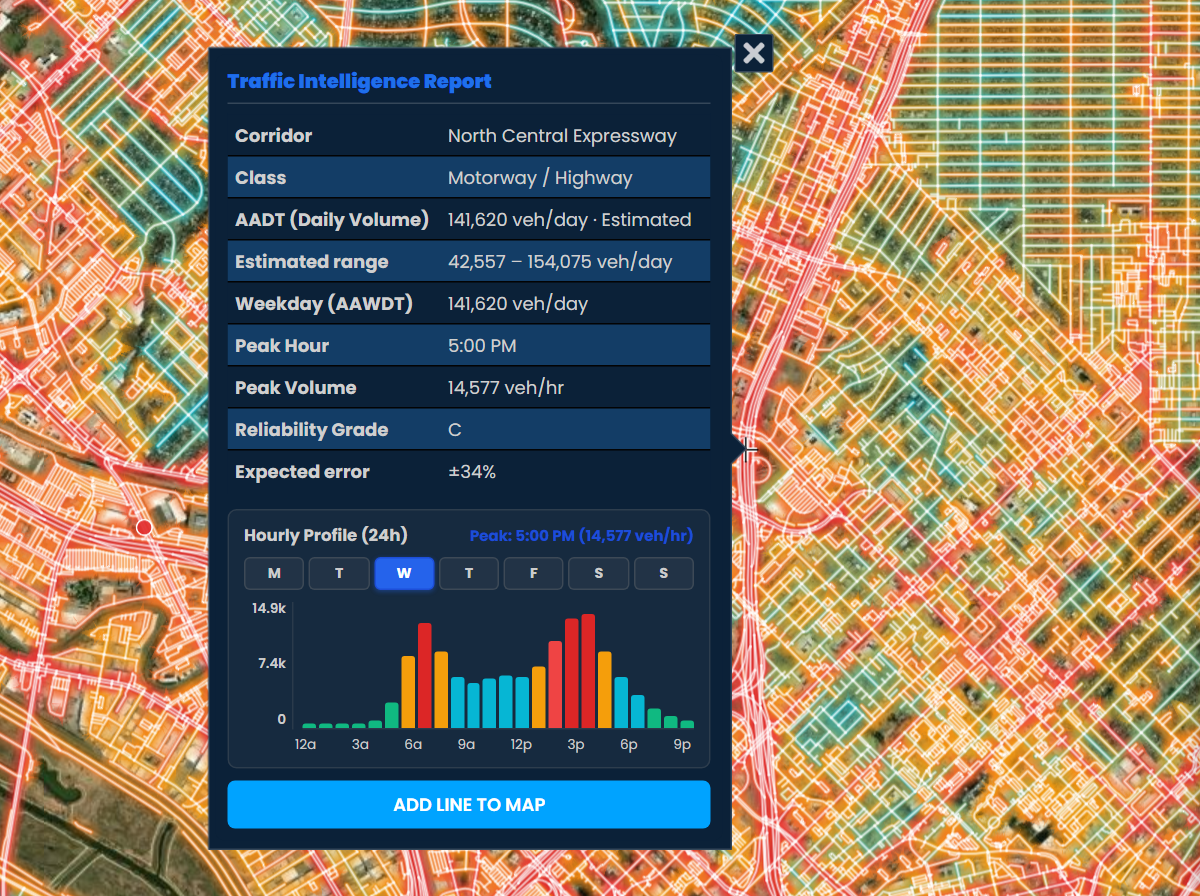
Measured roads show the official DOT count and its year. Estimated roads show a low to high range, a reliability grade, and an expected error, so you can weigh each number before you base a decision on it.
Scribble AI
Tell Scribble AI what you need. Try “draw a 500m buffer around every site,” “import this CSV and color by status,” or “measure the route from the depot to each stop.” It does it in seconds. No GIS training needed, and your team gets the same map, ready to share.
Try Scribble AI →AADT stands for Annual Average Daily Traffic. It is the total number of vehicles that use a road in a year, divided by 365. Transportation departments, planners, retailers, and real estate teams use it as the standard measure of how busy a road is.
Measured roads use official traffic counts published by state departments of transportation, shown with the year of the count. Every other road gets an estimate from a machine learning model trained on hundreds of thousands of counted roads. It looks at the road type, lanes, speed, nearby jobs and places, and the counted roads around it.
Every estimate shows a reliability grade, an expected error, and a low to high range, so you can see how much to trust it before you use it. Estimates are strongest on highways and main roads and less precise on quiet local streets. Roads with an official count show the measured value.
AADT averages traffic over every day of the year. AAWDT, or Annual Average Weekday Traffic, averages only Monday to Friday. Weekday traffic is usually higher on commuter roads, so the report shows both.
Traffic Intelligence covers roads across the United States, in every state. Coverage for more countries is on the way.
No. Traffic Intelligence is part of the Scribble Maps Pro Business plan. There is no separate data license, no per-study fee, and no sales call needed to get started. Open the map, turn on the kit, and click a road.
Yes. Drop your candidate sites or billboard locations on the map, turn on Traffic Intelligence, and click the roads in front of each one. Compare their AADT, weekday traffic, and peak hours side by side.
Yes. Each road report has an hourly chart for every day of the week. The time slider recolors the whole map by hour, and the 24 hour simulation plays a full weekday or weekend so you can see when each road peaks.