 English
 Español
 Français
 Deutsch
 Português
 日本語
 中文
 العربية
 한국어
 Italiano
 Русский
 Türkçe
 Nederlands
 Polski
 हिन्दी
 Dansk
 Čeština
 Română
 Ελληνικά
 Tiếng Việt
 Suomi
 Українська
 Indonesia
 Svenska
 Norsk bokmål
 Hrvatski
 Magyar
 Български


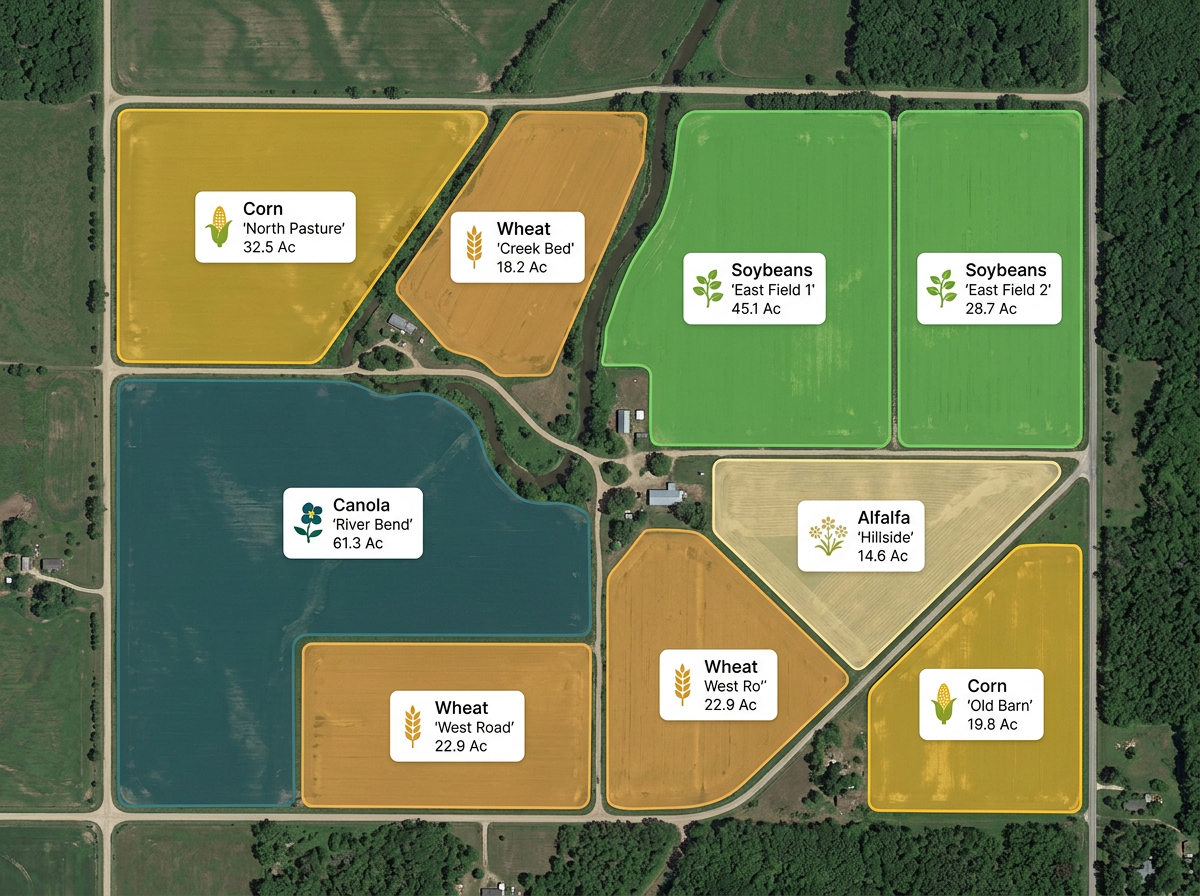
Field and paddock layouts
Draw every field or paddock by name, color by crop or rotation and share with operators, agronomists and family.

Sketch field layouts, plan paddock rotations and draw irrigation runs. See each field's soils and crop health, and export management zones to your tractor.
 4.7 / 5 · 200 reviews on G2
★ ★ ★ ★ ★“The thing I like most about Scribble is how easy it is to use. I also love how I can create any maps from scratch. A lot of the maps that I have created are not geo referenced. This has been very helpful to me when I have been creating these farm maps.”
Sketch field boundaries, paddocks and irrigation runs on real satellite imagery. No GPS unit, no GIS training.
Send the day's work map to the operator, agronomist or hauler. They open it on a phone. No app, no install.
Import KML, Shapefile, GeoJSON, GPX and CSV from monitors, drones and farm software. Layer it all on one map.
Farming kit
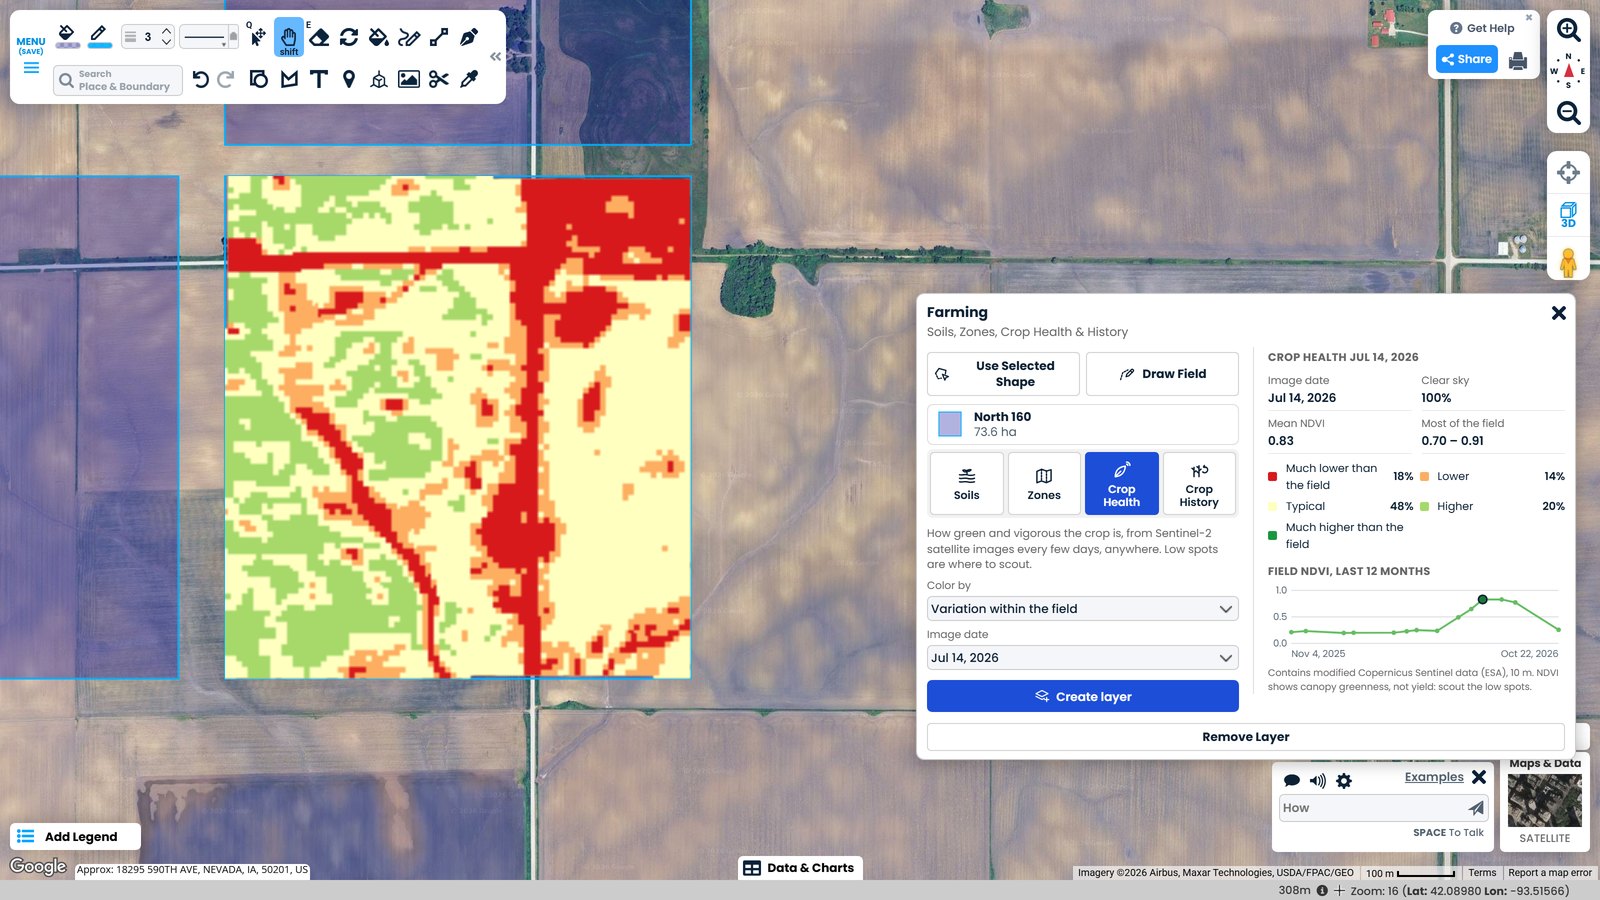
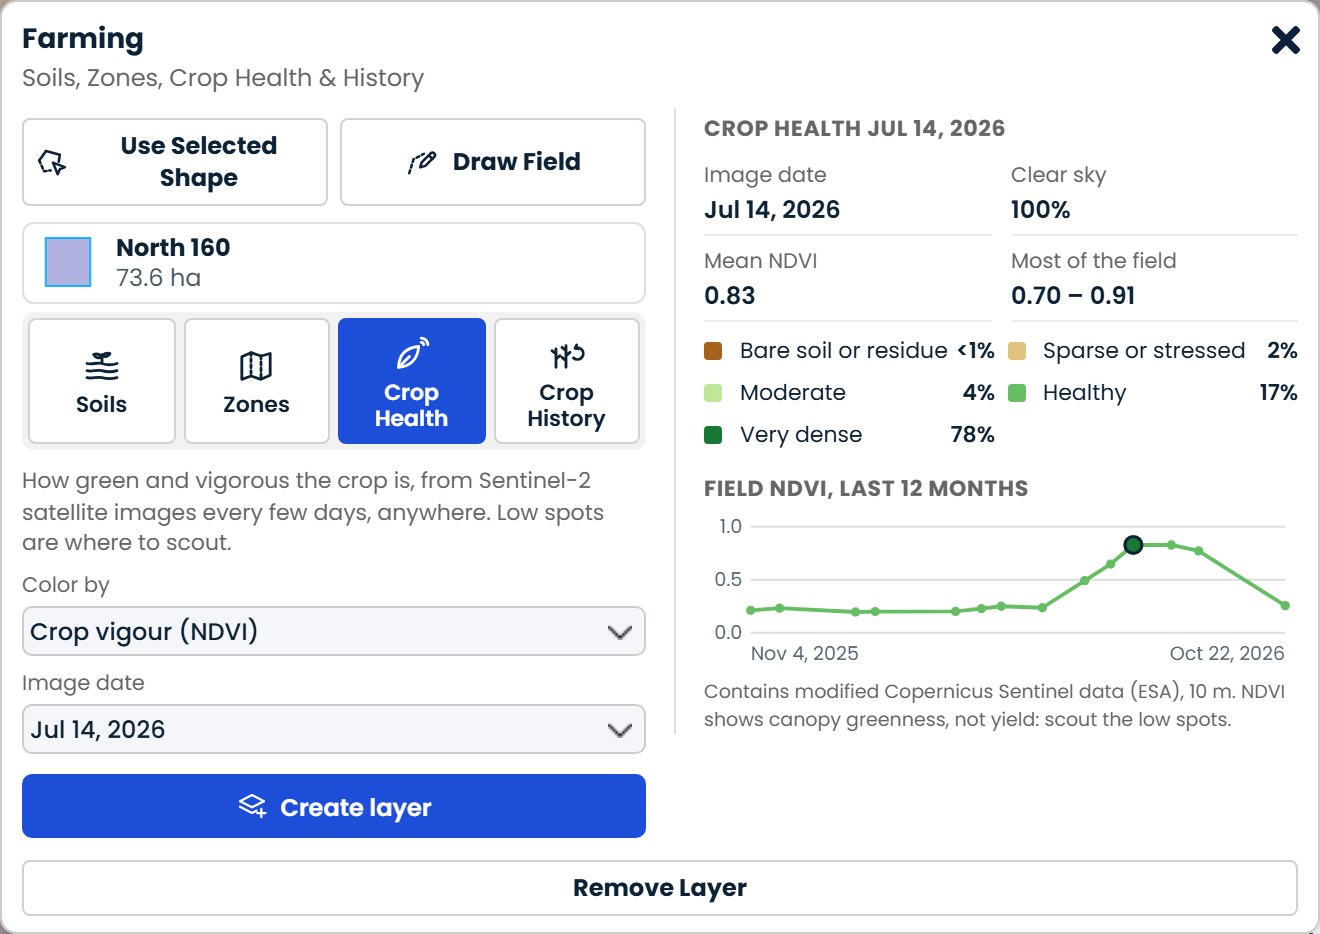
Draw a field anywhere in the world. The Farming kit maps its soils, shows how the crop is growing with NDVI from satellite images, and splits it into management zones you can load into your tractor.
Pro Business. 3 free field reports on any account.
Draw every field or paddock by name, color by crop or rotation and share with operators, agronomists and family.
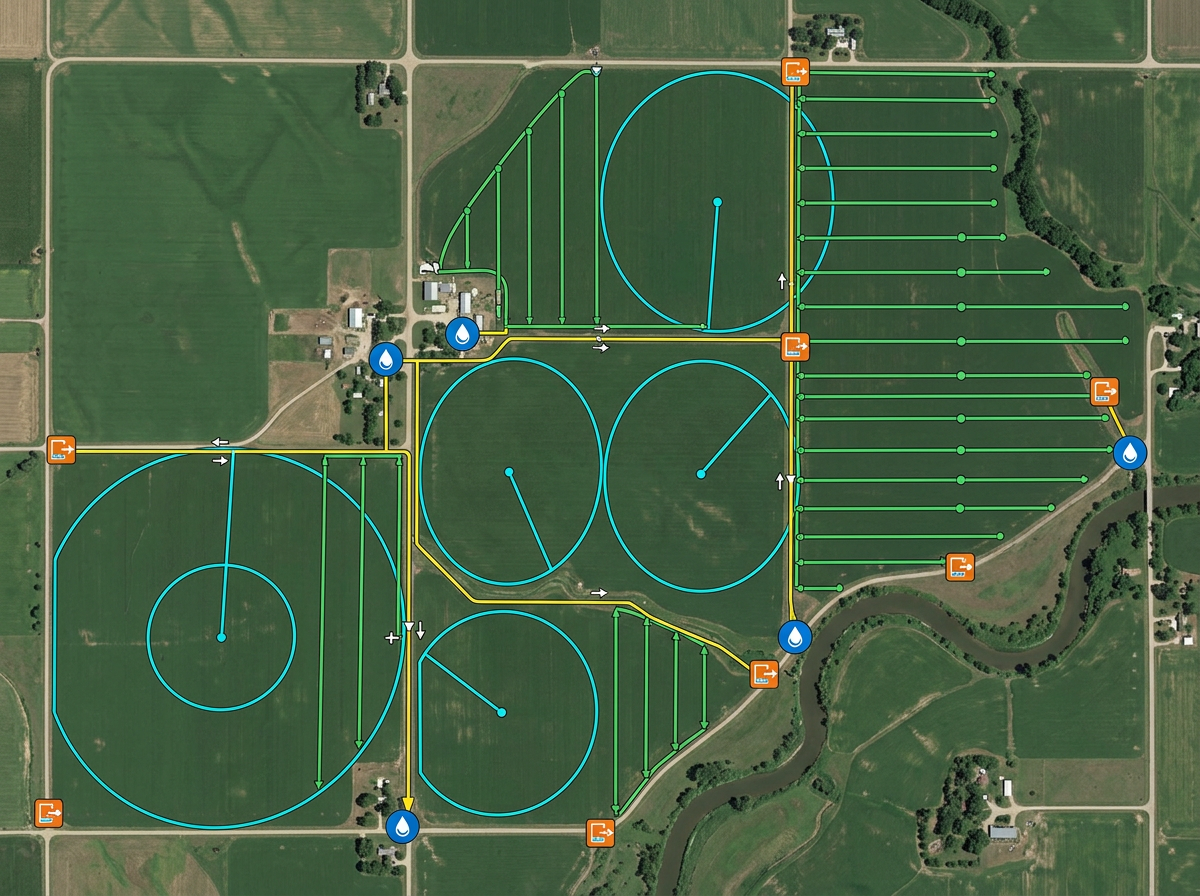
Sketch irrigation runs, pivot circles, drain tile and water sources for the crew and the irrigation contractor.
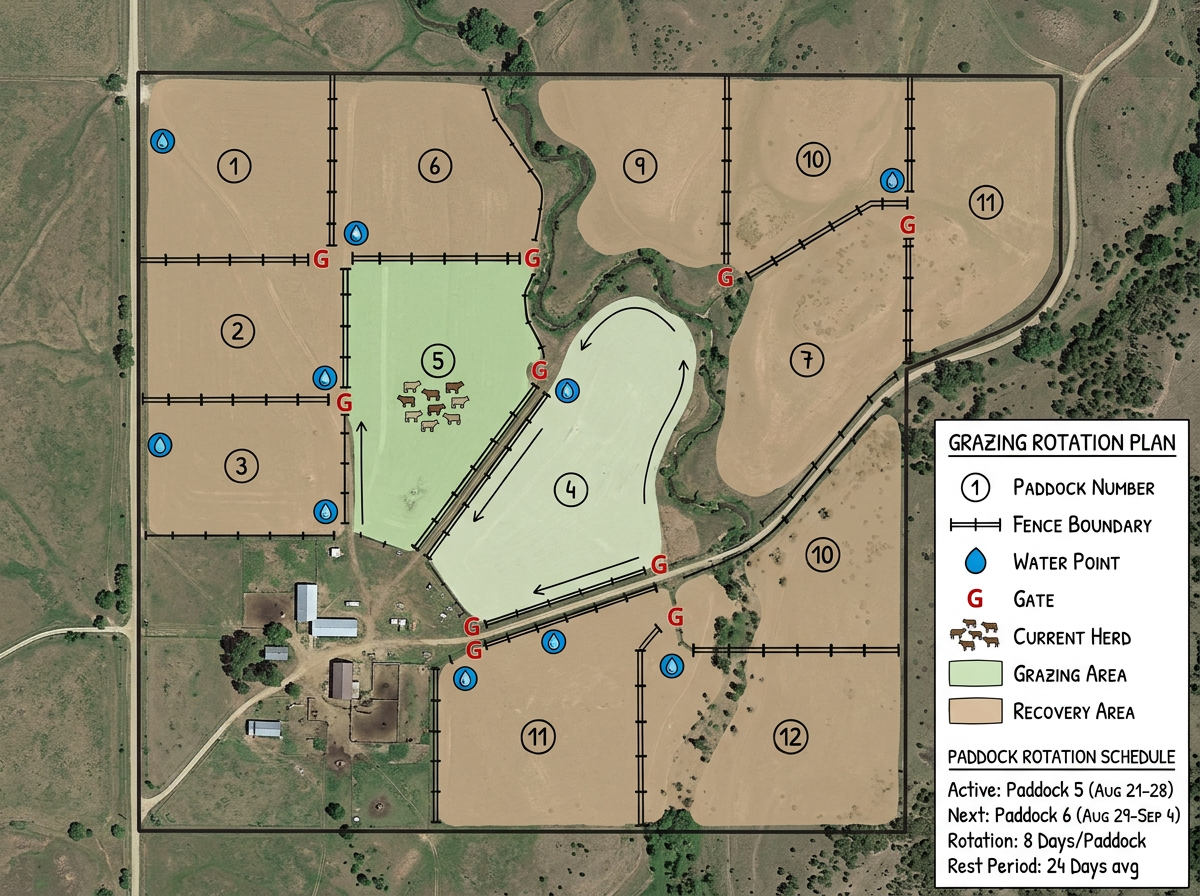
Lay out grazing paddocks, fences, water points and gates. Plan rotations and share the schedule with ranch hands.
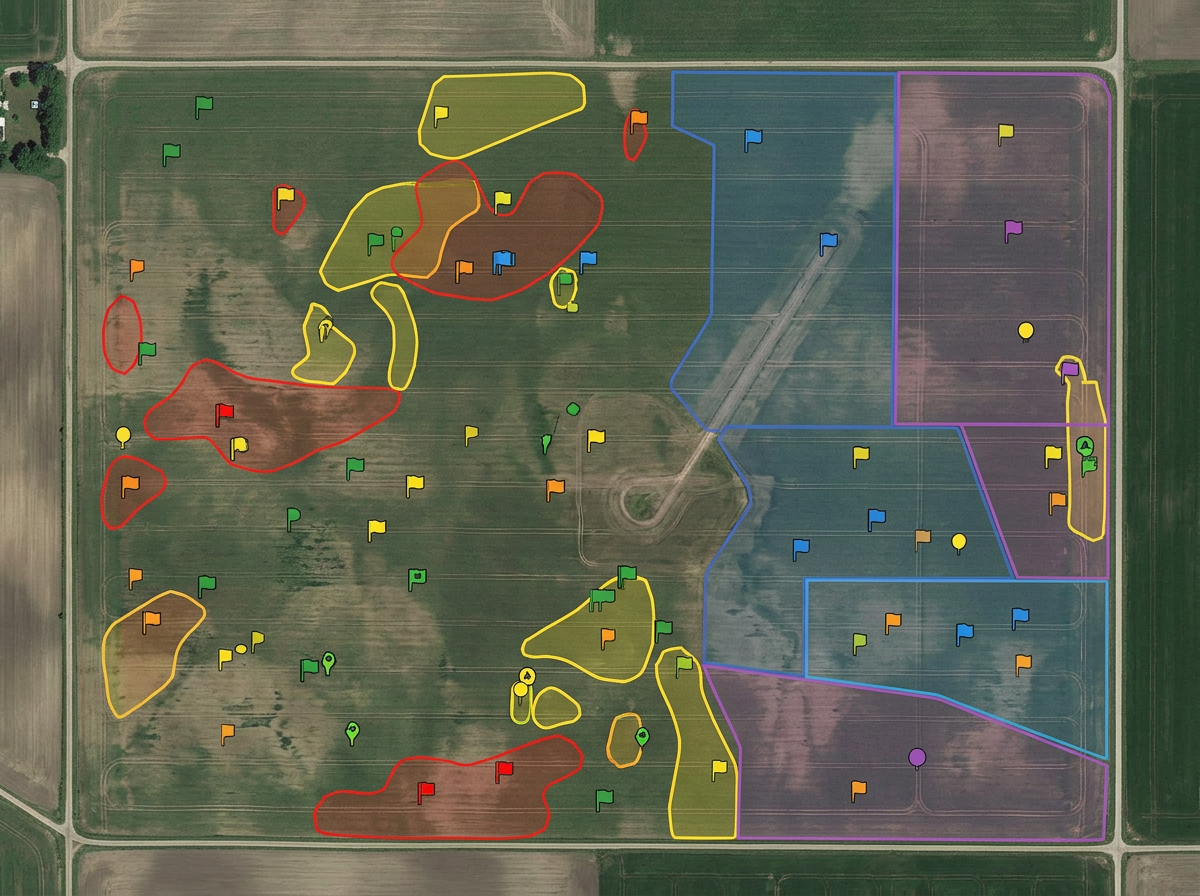
Build field exhibits for grower meetings, scout reports and program planning. Share by link or print to PDF.
Scribble AI
Tell Scribble AI what you need. Try “draw a 500m buffer around every site,” “import this CSV and color by status,” or “measure the route from the depot to each stop.” It does it in seconds. No GIS training needed, and your team gets the same map, ready to share.
Try Scribble AI →★ ★ ★ ★“The thing I like most about Scribble is how easy it is to use. I also love how I can create any maps from scratch.”
★ ★ ★ ★ ★“Easy to use to plan field layouts for planting new orchards on slopes.”
Yes. Import KML, Shapefile, GeoJSON, GPX or CSV. Existing field boundaries and yield data drop directly onto the map.
Yes. Click Share, copy the link and text it to them. They open it on a phone. No app, no install.
Yes. Sketch field boundaries directly on satellite imagery. No GPS, no field walk required.
Yes. Scribble Maps is free to start, with paid options for larger imports and advanced tools. See the pricing page for details.
Yes. Enter a U.S. Public Land Survey System (PLSS) legal description in search to preview and add the matching BLM reference boundary. This is available with Pro Business and is for mapping reference only, not a legal survey.
Yes. The Farming kit maps a field's soils and shows its crop health from Sentinel-2 satellite images, anywhere in the world. In the US it uses the USDA soil survey; elsewhere it uses the SoilGrids world soil map. It is part of Pro Business, and every account gets 3 free field reports.
Yes. The Farming kit splits a field into 2 to 6 management zones from soil ratings or from years of satellite crop vigour. Export them as a shapefile for John Deere Operations Center, Climate FieldView, Trimble and other farm software.
NDVI (Normalized Difference Vegetation Index) measures how green and dense a crop is, from satellite images. Bare soil reads about 0.1 to 0.2, and a full, healthy crop reads 0.6 to 0.9. The Farming kit maps NDVI across your field at 10 m from free Sentinel-2 images and charts it over the last 12 months. Color the map by crop vigour, or by variation within the field to find the weak spots worth scouting.
Sentinel-2 photographs every field every few days. The kit uses the latest clear image and skips cloudy days. You can also pick any clear day from the last 12 months to compare growth stages. NDVI shows how green the crop is, not its yield, so use it to decide where to walk.